Is the Retrace Over at the 50 SMA Daily for EUR/USD?
EUR/USD is hesitating at the 50 SMA after the 200 pip retrace
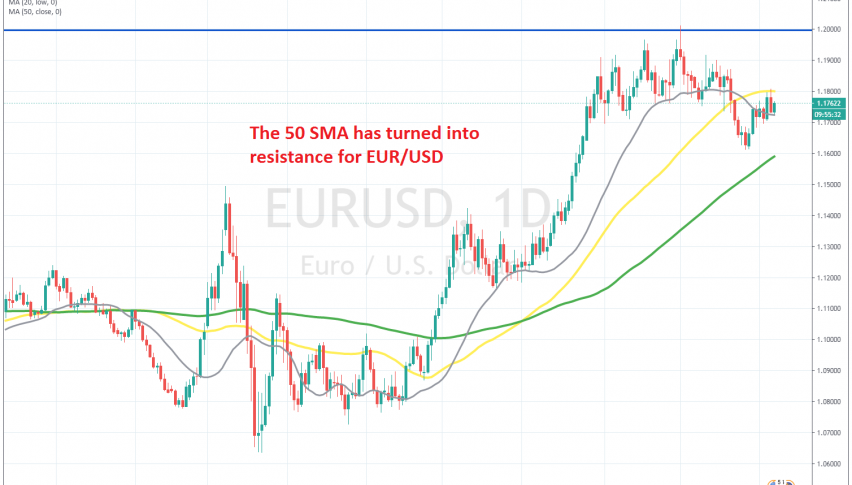
The EUR/USD surged from May until the end of July, as the USD turned bearish, climbing more than 10 cents higher. The bullish trend continued for another month, until September 1, but then the momentum was lost, and eventually the price reversed down, after piercing the 1.20 level, flushing off some weak stops above that.
After forming an upside-down hammer candlestick at the top, which signaled the bearish reversal, the EUR/USD headed down and broke the 50 SMA (yellow) on the daily chart. The EUR/USD declined to 1.1610s, but it reversed back up and has been bullish for the last two weeks.
Yesterday the price climbed above 1.18, but that’s where it met the 50 SMA (yellow) which seems like it might turn from support into resistance now. This appears to be a good place to go short, since the failure to stay above 1.20 was a strong signal that the objective for buyers had been reached, and now the pressure has shifted to the downside. So, we will try to go short if we get a bearish reversing signal on the smaller charts, and of course, if the 50 SMA holds.
- Check out our free forex signals
- Follow the top economic events on FX Leaders economic calendar
- Trade better, discover more Forex Trading Strategies
- Open a FREE Trading Account


