Decisive Time for the USD, as DXY Faces the 50 Daily SMA
The USD is trading at the 50 SMA now on the daily chart
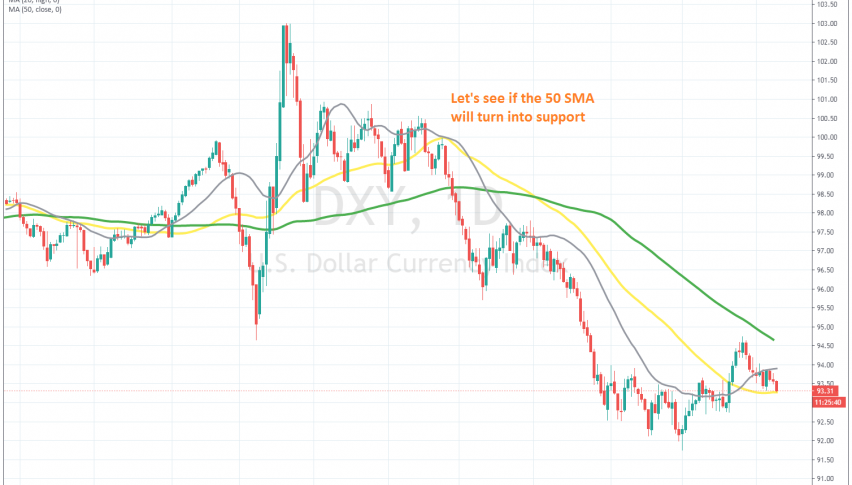
The USD has been bearish since the middle of March, after the surge from the coronavirus panic ended. The buck has lost ground continuously since then, as the USD index DXY shows on the daily chart above. The decline stopped in early June and we saw a small retrace up, as the sentiment began to improve after the reopening.
The bearish trend resumed again, continuing until the beginning of September. The DXY formed a hammer candlestick on the daily chart, which is a bullish reversing signal after the big decline. Then the DXY reversed higher, climbing around 300 points until September 25.
But, the retrace ended at 94.70 points, and in the last two weeks, the USD index has been declining once again. The price fell below the 20 SMA (gray) which turned into resistance, and now the DXY is facing the 50 SMA (yellow). The 50 SMA stands at 0.9125 and will decide whether the USD remains bearish or if it is likely to turn bullish soon. If the 50 SMA holds, then we should see a bounce, and the USD will reverse against other currencies. Otherwise, if the 50 SMA gives way, more downside momentum will follow.
- Check out our free forex signals
- Follow the top economic events on FX Leaders economic calendar
- Trade better, discover more Forex Trading Strategies
- Open a FREE Trading Account
- Read our latest reviews on: Avatrade, Exness, HFM and XM
Related Articles

Sidebar rates
Related Posts
