USD/CAD Remains Stuck Between 2 MAs
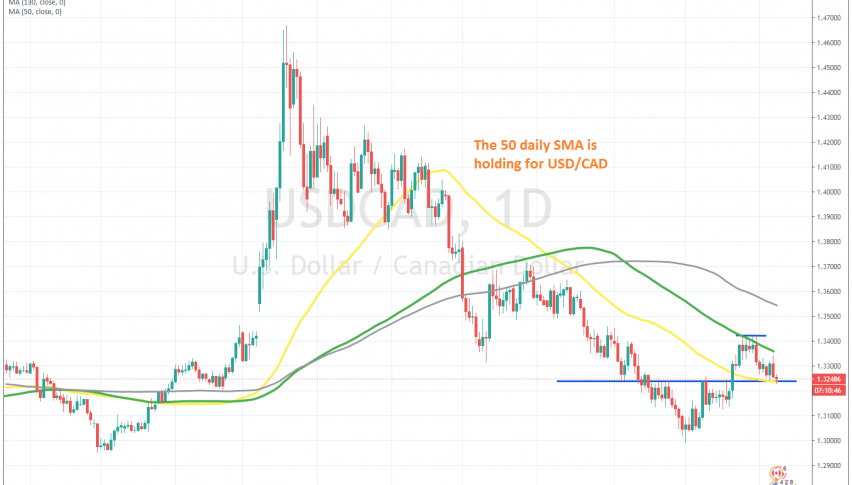
The 100 SMA rejected USD/CAD last week, but the 50 SMA is holding as support on the daily chart
The USD/CAD surged around 15 cents higher during the initial coronavirus panic, as traders turned to the USD as a global reserve currency, while, as a risk currency, the CAD declined. The bearish move in crude oil also helped push the CAD lower, since the CAD is closely correlated to oil prices.
But after a doji candlestick on the daily chart, below 1.47, which is a bearish reversing signal after the climb, the trend in the USD/CAD shifted. From then, the pair remained bearish until September 1, when it briefly dipped below 1.30. Then the price retraced higher, climbing more than 400 pips, as the USD buyers returned.
But, it isn’t clear whether this is just a retrace before the bearish trend resumes again, or whether this is a proper reversal. Moving averages will decide that, as this pair has been bouncing between them in the last two weeks. The 50 SMA (yellow) is providing support on the daily chart, and the 100 SMA (green) is providing resistance.
Sellers were trying the 50 SMA yesterday, after the 100 SMA rejected the price, but the 50 SMA held. If the 50 SMA and the support at 1.3250, where this moving average stands, should break, then the bearish trend will become active again. If the price bounces and breaks above the 100 SMA, then the buyers will take charge. So, until one of these MAs breaks, the trend will be unclear.
- Check out our free forex signals
- Follow the top economic events on FX Leaders economic calendar
- Trade better, discover more Forex Trading Strategies
- Open a FREE Trading Account


