The Bullish Trend Is Not Over Yet for AUD/USD, as the 50 SMA Gets Broken Again
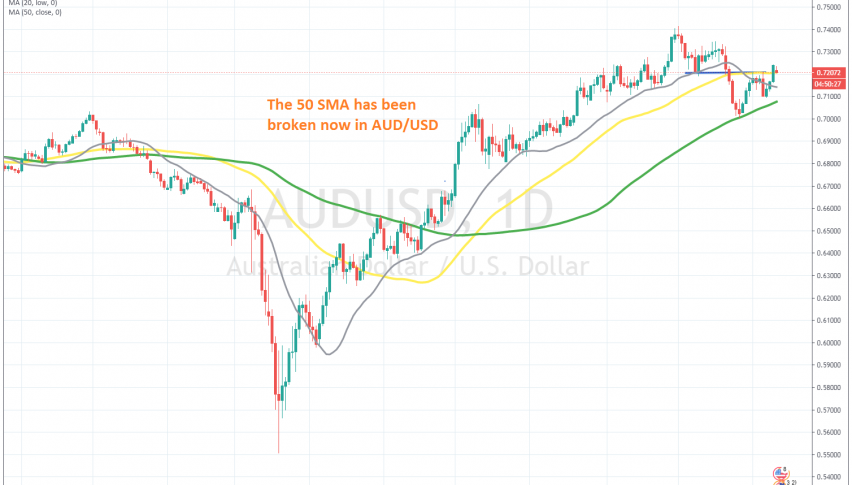
AUD/USD has moved above the 50 SMA again on the daily chart

The AUD/USD has been one of the most bullish pairs since March, during the big USD decline. This pair climbed more than 19 cents, although the pace of the climb has slowed considerably since June. But, the 20 SMA (gray) has continued to provide support, which in turn, has kept the bullish trend going.
Last month though, the price started to reverse, after a doji candlestick on the daily chart. The 20 SMA continued to hold until the fourth week of September, but it gave up eventually, and the 50 SMA closed without much resistance. But the decline stopped right at the 100 SMA (green), which stood at exactly 0.70.
The price bounced off that moving average, but the 50 SMA (yellow) turned into resistance and stopped the climb. This was a sign that the bullish trend might have come to an end, given the lower high and the fact that MAs were turning into resistance.
However, the price came back up, pushing above the 50 SMA on Friday. Yesterday we saw a slight pullback, but this moving average has lost importance now, as the price has ignored it for the last two days. So, the bullish trend hasn’t ended yet, and I think that we will see a lot of uncertainty until the US elections are over, and both sides accept the winner.
- Check out our free forex signals
- Follow the top economic events on FX Leaders economic calendar
- Trade better, discover more Forex Trading Strategies
- Open a FREE Trading Account


