The Bullish Trend is on for the EUR/JPY, as MAs Continue to Provide Support


The EUR/JPY traded on a bullish trend from the first week of May, when the Euro turned bullish, after comments regarding the ECB’s PEPP program, which was initiated to help the economy in through the crisis. This pair remained bullish until September 1, climbing more than 13 cents in total.
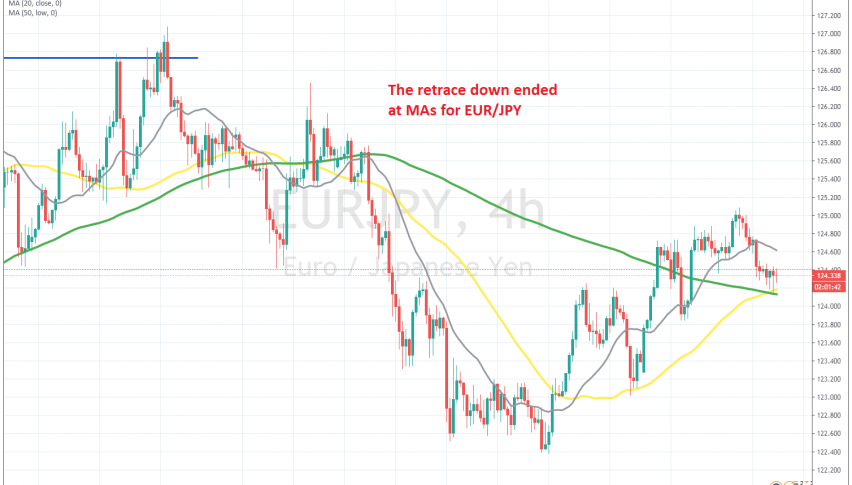
In September, we saw a pullback lower, which took the EUR/JPY around 500 pips down, but it turned out to be just another retrace in this long-term uptrend, before the next bullish move. The retrace down ended in the last week of September, and since then, this pair has been bullish again.
The reversal came at 122.40, and the price has been bullish since then, with moving averages turning into support. The 20 SMA (gray) provided support on the H4 chart, when the pace of the bullish trend increased, while the 50 SMA (yellow) has been the ultimate support for this pair. Yesterday, we saw a retrace in this currency pair, which took the price nearly 100 pips down, but the 50 SMA held as support once again, this time aided by the 100 SMA (green).
The previous H4 candlestick closed as a hammer, which is a bullish reversing signal, and the price is starting to climb already. So, a bullish reversing chart pattern has formed in this time-frame. So, we will try to open a buy forex signal, although, we will wait a bit longer to see if we can get a better entry price lower down, so that we can minimize the risk.