Selling AUD/USD at MAs, as it Fails
The AUD/USD has been one of the most bullish pairs since March, when the crash from the COVID-19 panic ended. This pair climbed until September 1, rising above 0.74, before the bullish trend finally ended, as USD buyers returned for some time, sending this pair down to 0.70, where the 100 SMA was waiting on the daily chart.
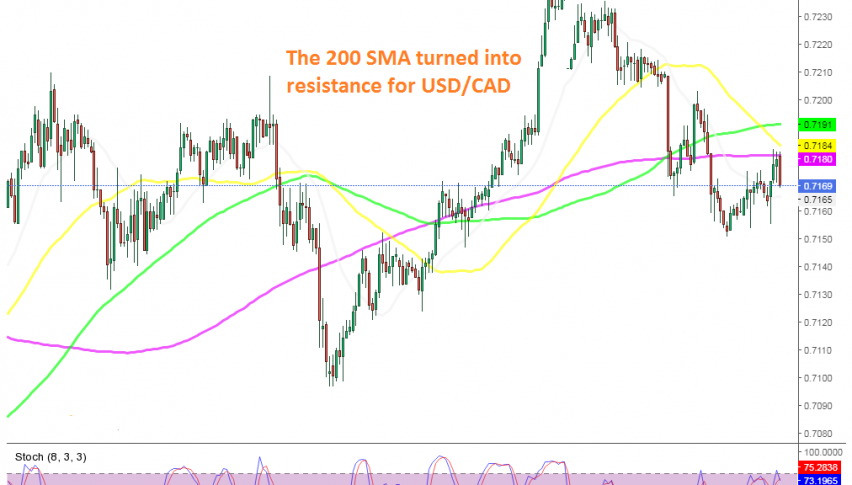
Then the price bounced off the 100 SMA, but the bounce ended at the 50 SMA on the daily chart on Friday last week. In the last three days, we have seen the price fall back down in this pair, and it broke below the moving averages on the H1 chart without much resistance from them.
The AUD/USD fell to 0.7150, but started reversing up yesterday, during the US session. The price reached the 200 SMA (purple) earlier today, but buyers failed to break above it after a few hours, so we decided to open a sell forex signal, since the stochastic indicator was also overbought in this time-frame. Now the price has reversed back down, so our trade here looks good.


