Oil Continues to Get Squeezed Between MAs on the Daily Chart
The range is getting narrower in Oil, as MAs get closer
Crude Oil was really bullish from April until August, with US WTI Crude surging from around -$ 40 to $ 43.50. But the surge slowed down from July, posting minimal gains during most of the summer, which was a signal that buyers had run their course.
During July and August, the price was leaning on the 20 SMA (gray) on the daily chart. So, the 20 SMA was providing support on this time-frame, but the price stuck to it too long, which was another sign that a bearish reversal was going to come soon.
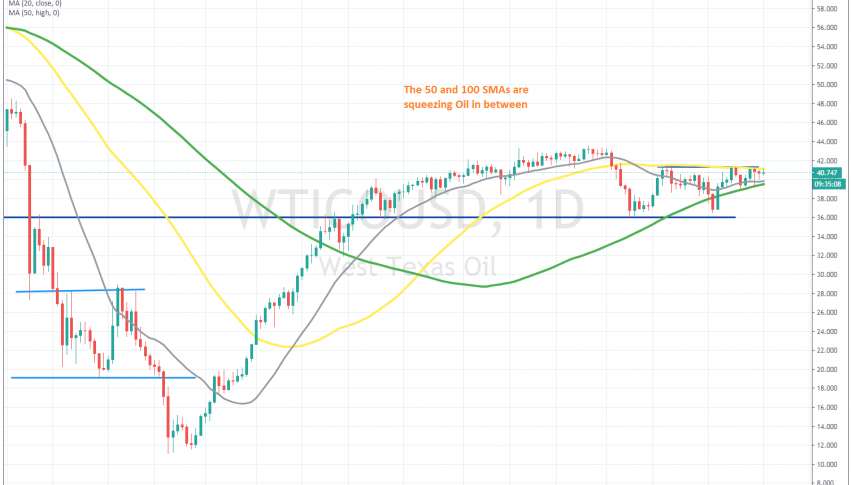
The reversal came as soon as the summer ended, and crude oil broke below the 20 SMA and the 50 SMA (yellow) on this chart. But the decline stopped at $ 36, which acted as support and resistance back in June. The price bounced off that level, but the 50 SMA turned into resistance this time, and has been keeping oil beneath it since then.
Now, the 100 SM (green) has turned into support for crude oil, and it is pushing the lows higher, while the 50 SMA is keeping the highs stable, meaning that the range is getting narrower in oil – it is now only around 100 pips wide. So, we will probably see a breakout soon, and we will try to trade that breakout, but only when it happens. Until then, we can still trade the range between these two MAs, with small trades.
- Check out our free forex signals
- Follow the top economic events on FX Leaders economic calendar
- Trade better, discover more Forex Trading Strategies
- Open a FREE Trading Account
- Read our latest reviews on: Avatrade, Exness, HFM and XM
Related Articles


Sidebar rates
Related Posts
