USD/CAD Forming a Head and Shoulders Pattern, as MAs Turn Into Resistance Again
USD/CAD reversed down, after failing at the 50 SMA last Friday
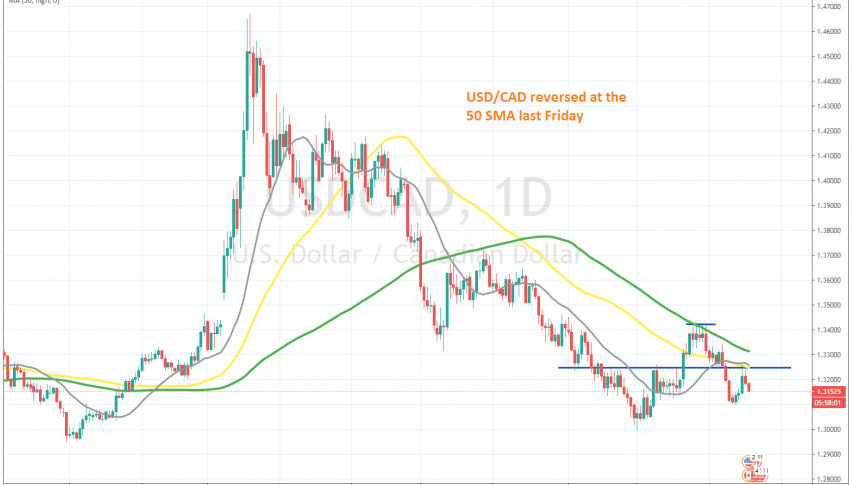
The USD/CAD has been bearish since the middle of March, when it reversed down, following the surge due to the coronavirus. The decline took this pair below 1.30, sending it nearly 17 cents lower, but the price didn’t stay below that big round level too long, and then it reversed back up.
That was a sign that the bearish trend might have come to an end, since buyers pushed the price more than 400 pips higher. But, the 100 SMA (green) stopped the climb and reversed the price back down, after it had formed several double top candlesticks below that moving average.
The USD/CAD was heading down, but last week we saw another retrace up, although, this time it was the 50 SMA (yellow) that was providing resistance, with a little assistance from the 20 SMA (gray). Now a resistance zone has formed at around the 1.3250 level, and the last retrace looks like the left shoulder of a head and shoulder pattern. If this pattern works out, we should see a 300-pip decline from 1.31, which means 350 pips down from here.
- Check out our free forex signals
- Follow the top economic events on FX Leaders economic calendar
- Trade better, discover more Forex Trading Strategies
- Open a FREE Trading Account
- Read our latest reviews on: Avatrade, Exness, HFM and XM
Related Articles


Sidebar rates
Related Posts
