MAs Keep the Downtrend Going in Gold
Gold is trying to break below the 100 SMA on the H4 chart
While in the past month the price action has been bullish in Gold, if we zoom out on larger carts, such as the daily time-frame, we can see that the trend has been bearish since early August. The price dived more than $200 lower back then and despite many attempts to turn bullish, the trend remains bearish.
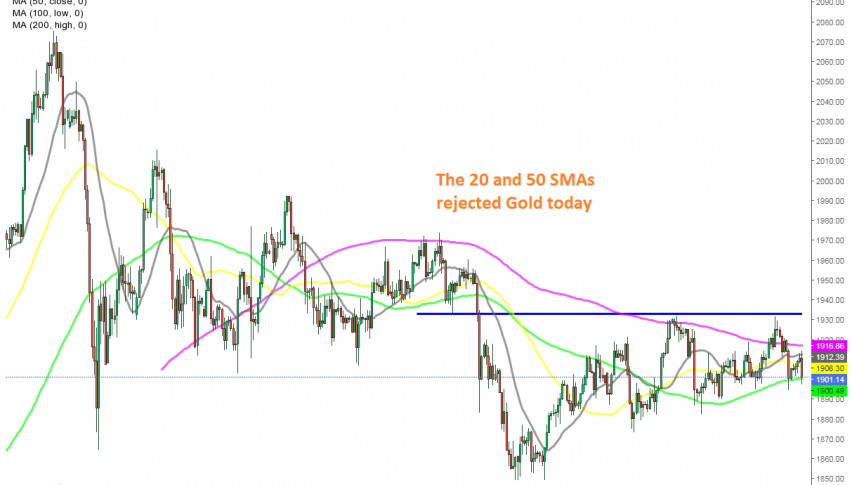
Highs keep getting lower each time and moving averages have come nto play now. The 200 SMA (purple) turned into resistance since the middle of September. The 100 SMA turned into support for some time, but it is being broken as I write.
Gold bounced off this moving average yesterday, but the 20 SMA (grey) and the 50 SMA (yellow) turned into resistance, reversing the price down. Today the 100 SMA was pierced just a while ago, but the price has pulled back up and is trading around this moving average. The 100 SMA has been pierced before but the price has moved back up. Now let’s see if this will be another of those cases, or whether Gold will close below it and turn more bearish. If the 100 SMA hold, we might go long.
- Check out our free forex signals
- Follow the top economic events on FX Leaders economic calendar
- Trade better, discover more Forex Trading Strategies
- Open a FREE Trading Account