USD/CAD Seems to Be Heading for the 50 SMA
USD/CAD is surging today due to the crash in crude Oil prices

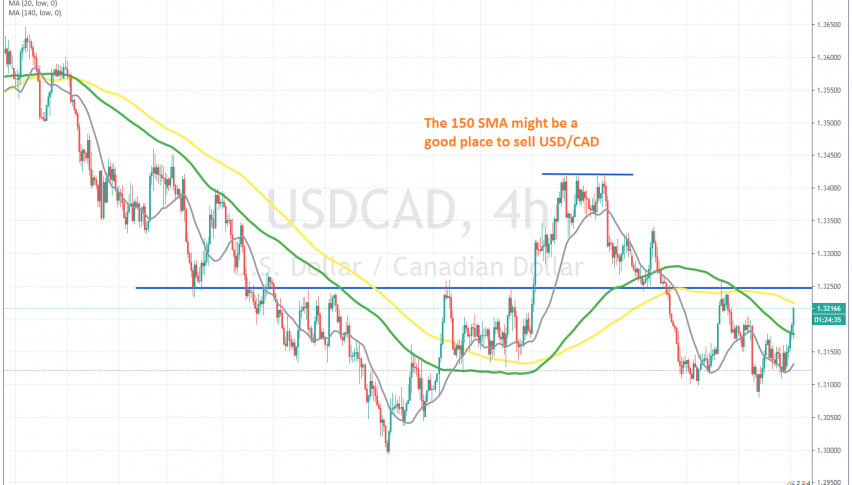
[[USD/CAD]] used to be on a bearish from March until the beginning of September, when it dipped below 1.30 for a short time. During that period, moving averages were doing a great job as resistance, particularly the 100 SMA (green) in July and August.
But, after flushing some weak stops below 1.30, USD/CAD reversed and climbed more than 400 pips higher. Moving averages turned into support as the price was climbing, especially the 20 SMA (grey) and the 150 SMA (yellow), until the price formed a resistance area above 1.34.
The price reversed back down at the end of September and moving averages turned from support to resistance again. Last week was bullish for this pair and today the climb has picked up pace as crude Oil tumbles lower. The price has moved above the 100 SMA and now seems to be heading for the 150 SMA. Although, the climb has stalled for now, so let’s see if buyers will be able to push up to that moving average. We hope not, since we are short on this pair.
- Check out our free forex signals
- Follow the top economic events on FX Leaders economic calendar
- Trade better, discover more Forex Trading Strategies
- Open a FREE Trading Account


