The Decline in Gold is Strong, With Smaller MAs Turning Into Resistance
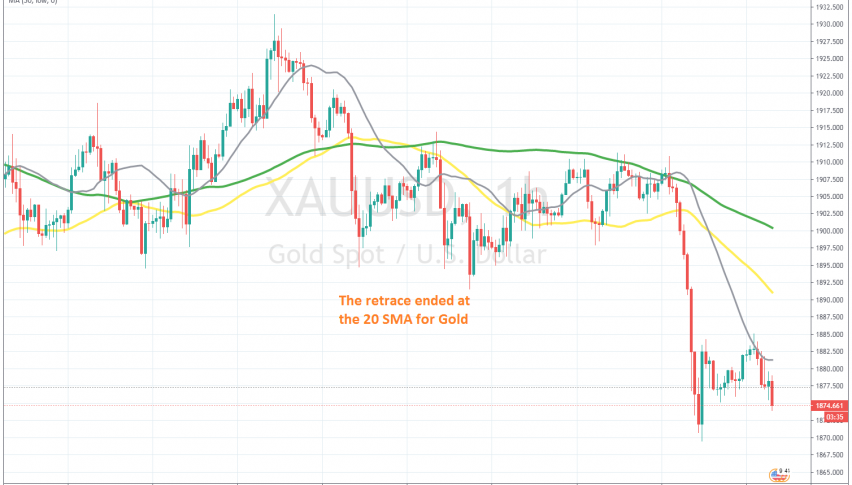
Gold retraced higher after the strong decline yesterday, but the 20 SMA reversed the price down
Gold has been really bullish this year, due to the coronavirus and the economic meltdown that followed, but the situation changed in the first week of August, when it made a swift reversal down. The decline took place in steps, as it normally does.
The first decline came in early August, then we saw a consolidation until the middle of September, when the second bearish wave came. But, the decline stopped at the 100 daily SMA, as I pointed out yesterday and gold was retracing higher until yesterday.
Yesterday the third wave of the decline came, as the USD surged higher. The 100 SMA was broken on the daily chart, which opened the way for further losses. On the H1 chart, we see that the price retraced higher yesterday, but the retrace ended at the 20 SMA (gray) on the H4 chart and the decline resumed after a doji candlestick up there, which is a bearish reversing signal.
This shows that the pace of the decline is quite strong, when the smaller moving averages turn into resistance. We had a winning forex signal yesterday, but missed the chance to sell the retrace at the 20 SMA today, since the reversal came early in the morning. But, we will see if there is another retrace higher, so we can go short again.
- Check out our free forex signals
- Follow the top economic events on FX Leaders economic calendar
- Trade better, discover more Forex Trading Strategies
- Open a FREE Trading Account