MAs Turn Into Support for Ethereum
Ethereum has been finding support on MAs, as the bullish trend has resumed again
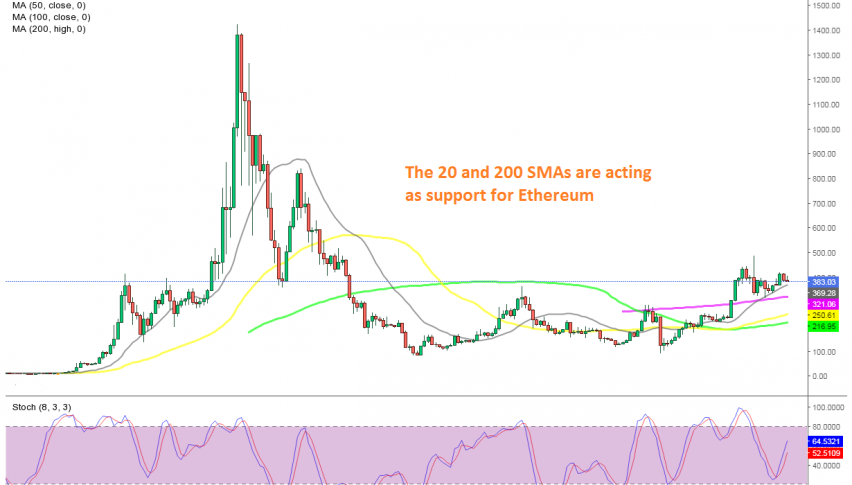
Ethereum was trading in a range, consolidating from 2018, when the price came off the mountain top after the big surge at the end of 2017. But, after a decline in March, the price reversed and it has been bullish ever since. The weekly chart shows that ETH/USD bounced between $ 100 and $ 400, roughly speaking.
The 100 SMA (green) was providing resistance early in 2020, pushing the price down, but the support area around $ 100 held once again, and Ethereum began trading on a bullish trend. Then, the top of the range was broken and the price approached $ 500.
But in the first week of September we saw a retrace lower, as the USD reversed higher, after declining for many months. But it looks like the 20 SMA (gray) has now turned into support on the weekly chart. This moving average has been holding as support during the last two months, pushing Ethereum higher.
The 200 SMA (purple) added to the resistance early this month, but it turned into support in September. The stochastic indicator was oversold until early October, but it has reversed back up now, so everything is pointing up on the weekly chart. We should wait for the slow retrace of the last two weeks to end and the 20 SMA to catch up, so we can go long on ETH/USD.
- Check out our free forex signals
- Follow the top economic events on FX Leaders economic calendar
- Trade better, discover more Forex Trading Strategies
- Open a FREE Trading Account
- Read our latest reviews on: Avatrade, Exness, HFM and XM
Related Articles


Sidebar rates
Related Posts
