USD/CAD Forms A Double Top Pattern
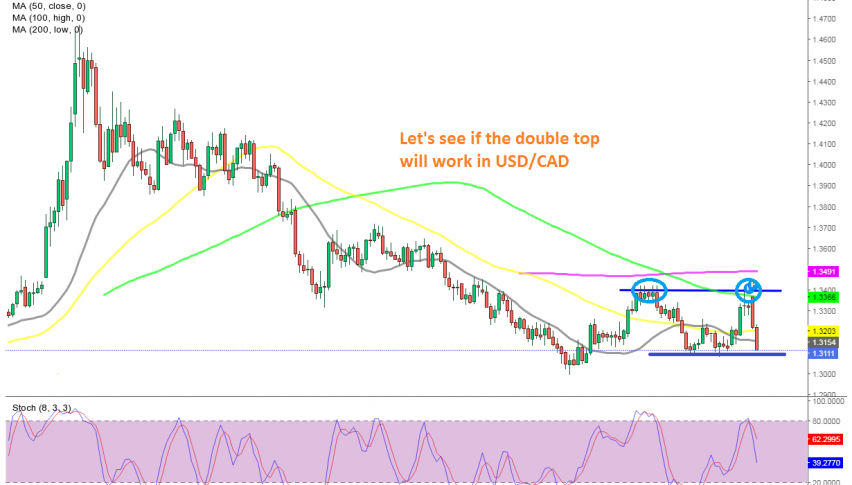
USD/CAD has formed a double top pattern on the daily chart

[[USD/CAD]] has been really bearish since March this year. The USD has been in a massive decline since then, while crude Oil made a strong reversal in April, coming from the abyss and climbing above $43. At some point, this pair dipped below 1.40, but then reversed back up.
Although, the climb ended above 1.34 at the end of September and the price resumed the decline again, falling to 1.31. In the last two weeks of October though, the trend changed and this pair climbed back up to 1.34. But that area held once again as resistance and the 100 SMA (green) added additional strength to it.
The stochastic indicator was overbought and the price formed 2 doji candlesticks up there, which are reversing signals. The reversal came eventually this week and USD/CAD is nearly 300 pips down from the top now. So, we have a double top pattern which will come into play if the neckline at 1.31 breaks. If that happens, then the target will be 1.28 and we might go short on a retest of 1.31 from below, assuming it will reject the price.
- Check out our free forex signals
- Follow the top economic events on FX Leaders economic calendar
- Trade better, discover more Forex Trading Strategies
- Open a FREE Trading Account


