Oil Undecided Between MAs
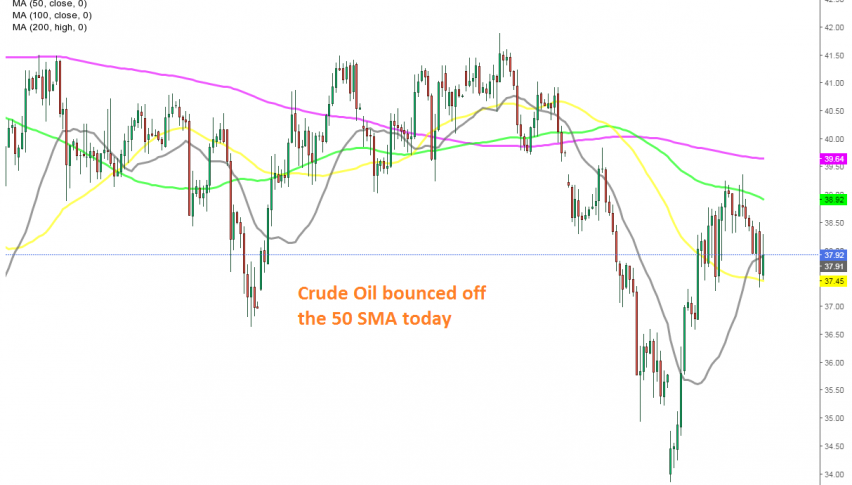
Crude Oil is bouncing between the 50 SMA and the 100 SMA on the H4 chart
Crude Oil turned quite bullish since the middle of April, with US WTI crude climbing more than $80 from the abyss. Although, the trend slowed in summer and by the beginning of September the trend shifted altogether. Moving averages were providing support on the daily chart, but they were eventually broken.
The end of October was quite bearish for crude Oil, as the USD strengthened and the price fell to $33.50. But, the USD turned quite bearish again this week and crude Oil benefited from that. US WTI crude surged more tan $5.50, climbing above $39 yesterday.
Buyers pierced the 100 SMA (green) on the H4 chart, but it didn’t break since candlesticks closed below it. Eventually the price reversed down, falling to $37.20. But the 50 SMA (yellow) turned into support for crude Oil and we are seeing a bounce of that moving average, So, Oil is holding on between the 50 and the 100 SMAs for a while, as long as the uncertainty remains and we might trade this range.
- Check out our free forex signals
- Follow the top economic events on FX Leaders economic calendar
- Trade better, discover more Forex Trading Strategies
- Open a FREE Trading Account


