

EUR/USD used to be quite bullish this year, riding on the back of pronounced USD weakness since March. Although the uptrend ended at the end of August, after this pair had pushed a little above 1.20, flashing out some weak stops above that big round level.
In September we saw a reversal down, but the decline ended above 1.16, which seems to have turned into a major support area for EUR/USD. In the last week of October, sellers had another attempt at the support but the area around 1.6 held again and last week this pair turned massively bullish again, as the USD crashed lower.
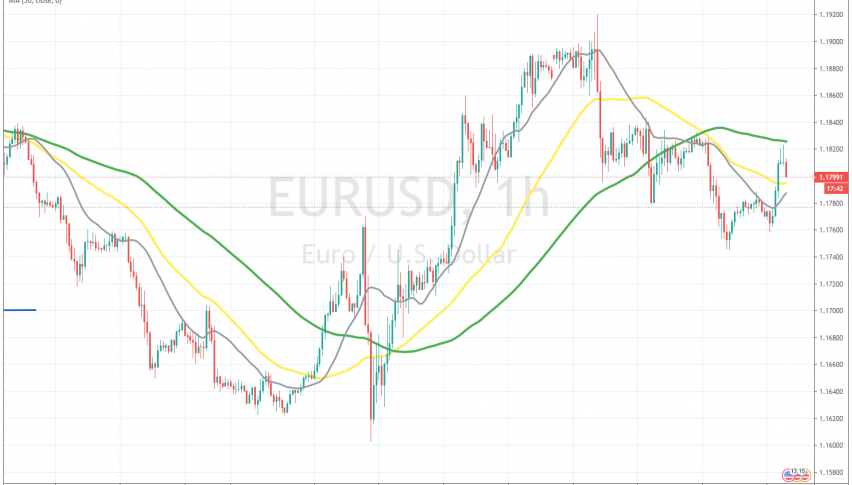
The price climbed above 1.9, but the news about the coronavirus vaccines turned the sentiment around, giving the USD some support. EUR/USD lost around 100 pips on Monday and the pressure reversed to the downside. Earlier today we saw a retrace higher, but it seems to have ended right below the 100 SMA (green) on the H1 chart. The two upside-down pin candlesticks pointed to a bearish reversal, so we decided to open a sell forex signal here after the retrace and now it looks like EUR/USD is reversing down again.