Crazy Movement in BTC/USD – Is It Going to Break Double Top?
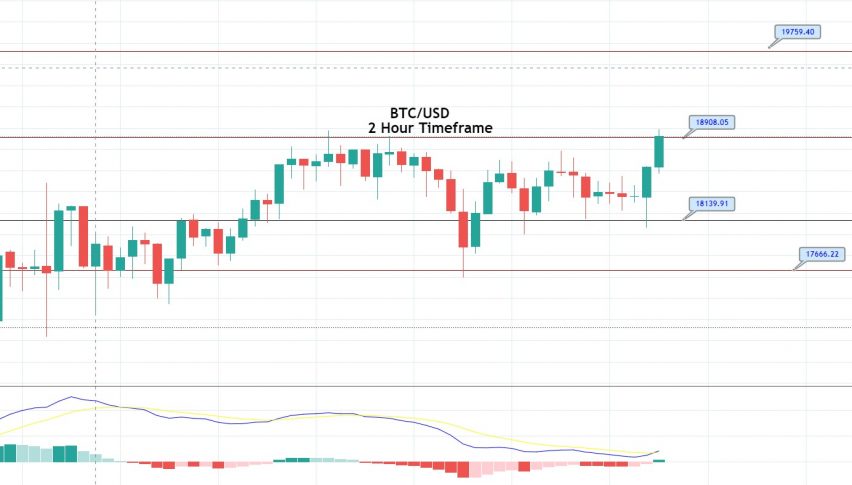
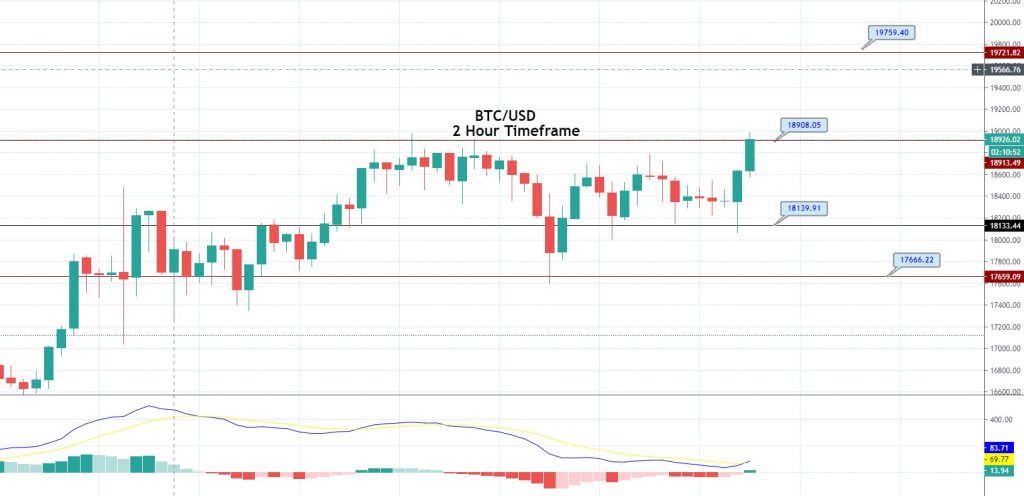
The BTC/USD pair is trading dramatically bullish, jumping from 18,139 support level to 18,900 resistance area. As of writing, the price is

The BTC/USD pair is trading dramatically bullish, jumping from 18,139 support level to 18,900 resistance area. As of writing, the price is now just below the 18,900 resistance level, which is extended by the double top resistance. The reason for the subdued bias around Bitcoin prices could be associated with the investor’s excitement and extreme greed.
The fear of missing out (FOMO) was also seen as a major factor behind the parabolic spike. Investors may face very slight resistance near $19,000, as the recent bullish engulfing candle on the 2-hour timeframe is reflect strong bullish bias among traders. The leading technical indicators such as MACD and RSI show bullish crossover and suggest strong odds of buying in the BTC/USD pair. Well, in case the BTC/USD manages to close candles over the double top level of 19,000 resistance, the odds of bullish trend continuation will become pretty substantial.

On the higher side, the breakout of the 19,000 resistance level can extend the bullish trend in the BTC/USD pair until the 19,759 area. Thus it’s worth taking a buy trade over 19,000 if BTC/USD confirms the breakout setup today. Alternatively, we can take a buying trade upon bearish correction until 18,350. Good luck!
- Check out our free forex signals
- Follow the top economic events on FX Leaders economic calendar
- Trade better, discover more Forex Trading Strategies
- Open a FREE Trading Account


