EUR/GBP Breaks the 50 SMA as the Retrace Continues, but Stalls at the 100 SMA
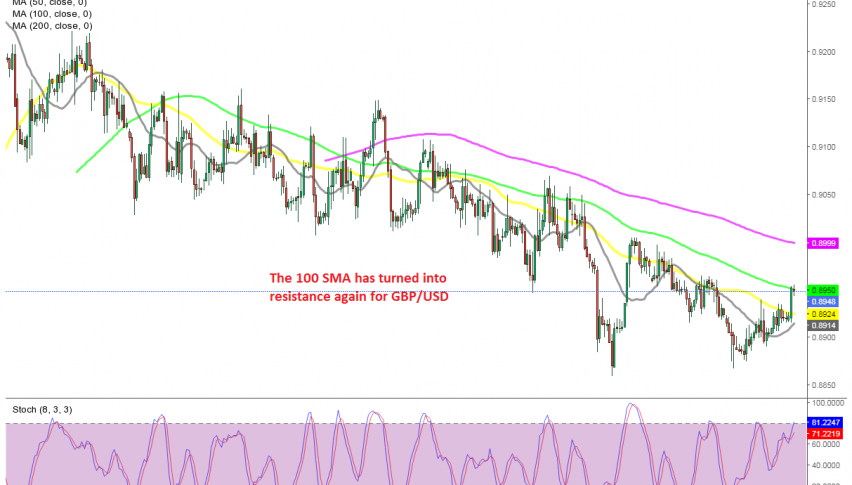
EUR/GBP has retraced above the 50 MA today, but the 100 SMA is stopping the climb now

The EUR/GBP has been on a bearish trend since the second week of September. The trend has been quite straightforward since then, with moving averages doing a great job as resistance on the H4 chart, which are also acting as descending trend-lines for this pair.
The 100 SMA (green) was doing the job until this month. Then the decline picked up pace and the 50 SMA (yellow) took over. This moving average has been pushing the GBP/USD down this month, and earlier this week, we decided to open a sell forex signal at that MA, as the price retraced higher.
Then the 50 SMA rejected this pair again, and the GBP/USD turned lower, but the price missed the take profit target by a mere 1 pip and reversed higher. The pessimistic comments about Brexit today are pushing the GBP lower, which has pushed the EUR/GBP up, in turn. The 50 SMA was broken, but the 100 SMA held as resistance and the price is reversing back down. Let’s hope that the bearish trend will resume again now, since we are short on this pair.
- Check out our free forex signals
- Follow the top economic events on FX Leaders economic calendar
- Trade better, discover more Forex Trading Strategies
- Open a FREE Trading Account


