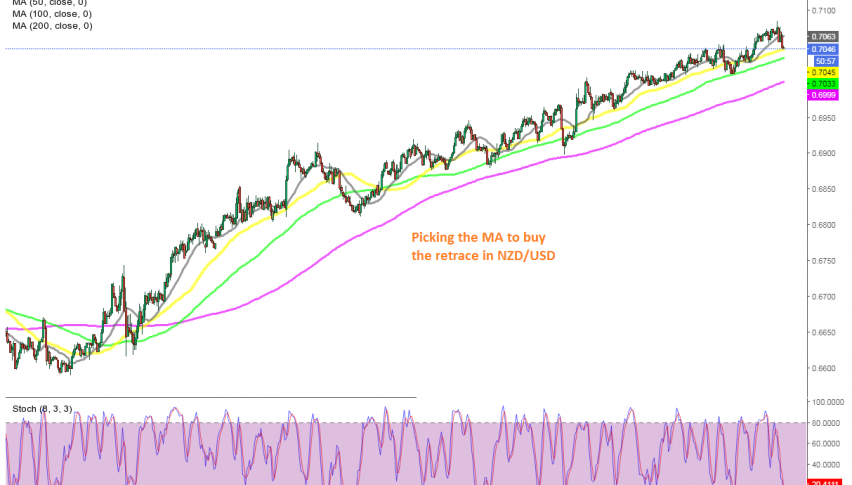
The NZD/USD has been one of the most straightforward pairs in recent months. Commodity currencies have been quite bullish since March/April, after they reversed from the coronavirus crash in February, but the Kiwi has been the most bullish among them, particularly in recent weeks.
This can be observed in the H4 NZD/USD chart above, which shows a 500 pip increase during November. During the increase last month, the price was finding solid support at moving averages on this time-frame chart. The smaller ones, such as the 20 SMA (gray) and the 50 SMA (yellow) have been supporting this pair when the trend has been strong, and the larger ones, such as the 100 SMA (green) and the 200 SMA (purple) have taken their turn when the pullbacks lower have been deeper.
Yesterday we saw a strong bounce off the 100 SMA, with the price gaining around 80 pips, as the EUR/USD broke above the big round level at 1.20, which has been acting as major support. Today though, we are seeing another pullback down, and now the price is at the 50 SMA.
But, the retrace down seems too confident, judging from the price action, so we will follow this pair to see if it will continue lower to the 100 SMA, which would be a great place to buy. So, if the decline stalls here and we get a bullish reversing candlestick above the 50 SMA, we might go long from here, so follow us on our forex signals section for live trade ideas.


