Will MAs Hold the Pullback in NZD/USD?
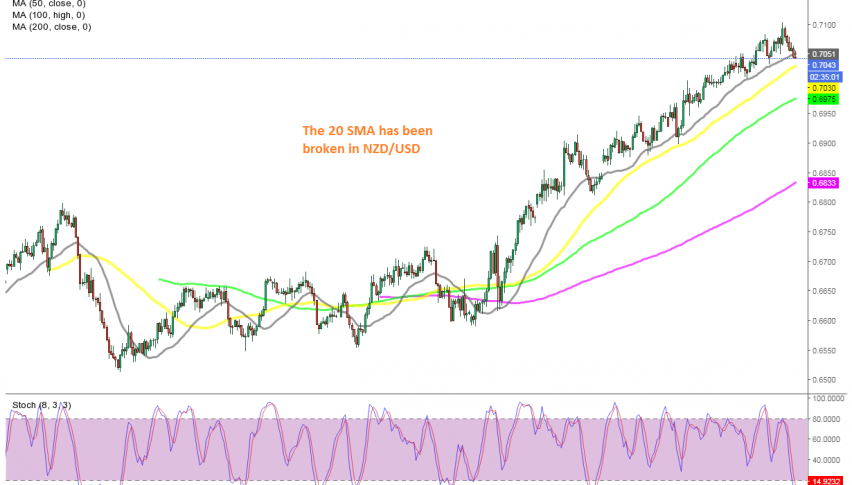
NZD/USD has just slipped below the 20 SMA , but the 50 SMA is waiting below on the H4 chart
Just like the Aussie, NZD/USD has also been on a strong bullish trend since the middle of March. The price has climbed more than 16 cents from the bottom and yesterday buyers pushed above 0.71. We had an open buy forex signal from earlier this week, which hit the take profit target yesterday.
Although, after the assault to the upside during the European session, the price started reversing down, following a doji candlestick which signaled the retreat down. NZD/USD has retreated around 60 pips down in the last few trading sessions, although the trend still remains quite bullish.
In November, the uptrend picked up pace as the USD weakened again, following the US elections early last month and moving averages have been doing a good job as support indicators. Today, the price has just slipped below the 20 SMA (grey) which has been solid support recently.
But the 50 SMA (yellow) remains ready to provide support on the H4 chart. We opened a buy forex signal early this morning, so we are hoping that NZD/USD bounces off one of these moving averages, since the retrace down is complete, as the stochastic indicator shows.
- Check out our free forex signals
- Follow the top economic events on FX Leaders economic calendar
- Trade better, discover more Forex Trading Strategies
- Open a FREE Trading Account


