Is the Retrace Over for Safe Havens?
Gold stopped declining this week and bounced around $80 higher

This has been one of the strangest years overall, which has made trading in financial markets very interesting. The risk factor has been immense, as the volatility has increased exponentially, with daily or weekly trading ranges exceeding thousands of pips for many trading assets.
There have been quite a few weeks when GOLD has crashed or rallied more than 1,000 pip per week, while cryptocurrencies have turned massively bullish and made some extraordinary moves in the last tow months. Stock markets also have gone through some roller-coaster rides this year, first when markets crashed at the end of February when coronavirus broke out in Europe and in the last two weeks of October, ahead of US presidential elections.
Safe havens have been bullish in the last two years, but this year they turned extremely bullish until August. In late February we saw a $ 250 dive in Gold during the initial coronavirus panic, then turned bullish again surging more than $ 600 higher, breaking above record highs previously.
Most market analysts were predicting further upside momentum for safe havens and Gold in particular back then, especially as the global economy started to soften again, after the big bounce following the spring lock-downs. The restrictions started increasing again in the following months, but Gold and Silver turned the tail back then and have been bearish since then, losing thousands of pips.
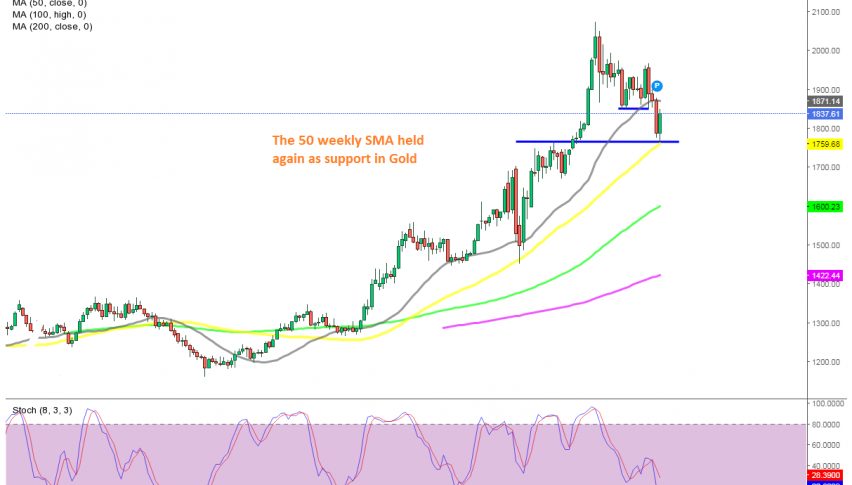
The situation hasn’t exactly been the same in all safe havens, since the JPY and the CHF have tried to keep the bullish momentum going. But, the precious metals have been declining,posting some major declines since August. Although, the decline might have come to and end, as the Gold chart above indicates.
Gold has lost more than $ 300 from the top, breaking the 20 SMA (grey) on the weekly chart, which provided support for some time. But, it seems like the decline has stopped at the 50 SMA (yellow) this week. The same moving average stopped the crash in February/March and the previous high at $ 1,750-60 turned into support this time. Gold bounced off that moving average again this week, climbing around $ 80, so the 50 SMA might have been the target for sellers.
SILVER also made a strong bullish move this week, which suggests that the decline in safe havens might be over. In fact, the main trend is still bullish on the larger time-frame charts and the pullback of the last few months seems more like a retrace, to refresh the charts before resuming the bullish trend. This weeks candlestick is smaller than the previous bearish one, which engulfs the current one, but the close this week was bullish nonetheless.
Besides that, fundamentals point up for safe havens. The FED will likely keep the dovish bias for quite some time and the stimulus package at around $ 2 trillion is expected to pass the US Senate soon. That means more USD in the markets, which weakens the Buck, sending commodity prices higher, including safe havens.
So, it would be prudent to be careful with shorts in Gold now and probably look at the long side. We might try to open a long term buy signal here, but will wait to see if there is another retest of the 50 SMA. If that happens and the 40 SMA holds again, then we might go long on Gold.
- Check out our free forex signals
- Follow the top economic events on FX Leaders economic calendar
- Trade better, discover more Forex Trading Strategies
- Open a FREE Trading Account


