Selling the Jump in USD/CAD?
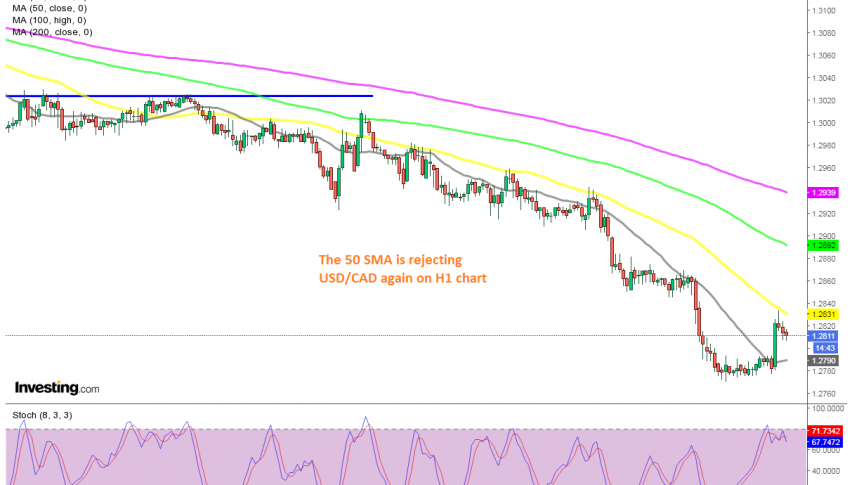
USD/CAD has bounced higher but it is finding resistance at the 50 SMA
The USD has been on a bearish trend since March, which picked up further pace in November, after the US elections, when the uncertainties about the future of the economy grew. The EUR/USD broke above 1.20, which has been the ultimate resistance for this pair, while the USD/CAD broke below 1.30, reaching 1.2770s last Friday.
The CAD has actually been one of the most bullish pairs since early November, gaining strength from the increase in crude oil prices, since the CAD is positively correlated to the oil prices. But, we saw a bounce in the USD/CAD this morning, which sent this pair around 60 pips higher.
But, the jump stopped right at the 50 SMA (yellow) on the H1 chart, which was providing resistance last week, as the downtrend accelerated. This shows that the downtrend is still strong, since the smaller moving averages are providing resistance and keeping this pair bearish. The chart setup looks like a bearish reversing pattern, after the upside-down hammer below that moving average and the bearish candlesticks which are following.
- Check out our free forex signals
- Follow the top economic events on FX Leaders economic calendar
- Trade better, discover more Forex Trading Strategies
- Open a FREE Trading Account


