Gold Bouncing Between Moving Averages
Gold is trading in a range between 2 moving averages this week
GOLD has turned quite bearish since the second week of August, when it reversed down form around $ 2,075. It used to be extremely bullish earlier this year, as the coronavirus lock-downs sent the global economy in a deep recession, which turned the markets towards safe havens.
But, the trend changed in August as the global economy was rebounding after the reopening. The global economy has weakened again after the new restrictions in Autumn, but the bearish momentum has remained in Gold, which sent the price down to $ 1,760s as the end of November.
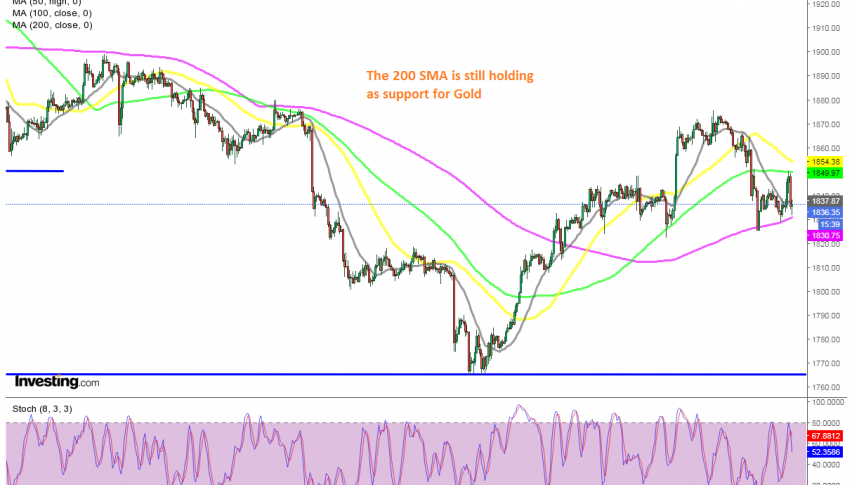
December has been bullish so far, but the upside is starting to look weaker after the reversal down yesterday. Although, the 200 SMA (purple) turned into support yesterday. The price bounced off that moving average after testing it twice, but the 100 SMA (green) turned into resistance on the H1 chart. The 100 SMA rejected the price earlier today and Gold lost around $ 20.
But, the decline seems to have stalled above the 200 SMA once again. So, it seems like a range is forming between these two moving averages on the H1 chart. We missed the opportunity to sell Gold at the 100 SMA earlier today, but might go long at the 200 SMA. Although buyers are more at risk, since the main trend is bearish.
- Check out our free forex signals
- Follow the top economic events on FX Leaders economic calendar
- Trade better, discover more Forex Trading Strategies
- Open a FREE Trading Account
- Read our latest reviews on: Avatrade, Exness, HFM and XM
Related Articles


Sidebar rates
Related Posts
