Is the Retrace Down Over at the 20 SMA for NZD/USD?
NZD/USD has formed a bullish reversing chart pattern
[[NZD/USD]] has turned really bullish since March and it has been picking up speed since the beginning of November, following the US elections, as the USD resumed the decline gain. During this time, NZD/USD has gained more than 17 cents from the bottom and is still progressing higher.
The economy of New Zealand turned positive on an annualized basis, as yesterday’s report sowed, which is impressive after the big decline in Q2, which sent the GDP YoY in a major contraction. During this time moving averaged have been doing a great job as support for NZD/USD, holding the pullbacks lower and pushing the price higher.
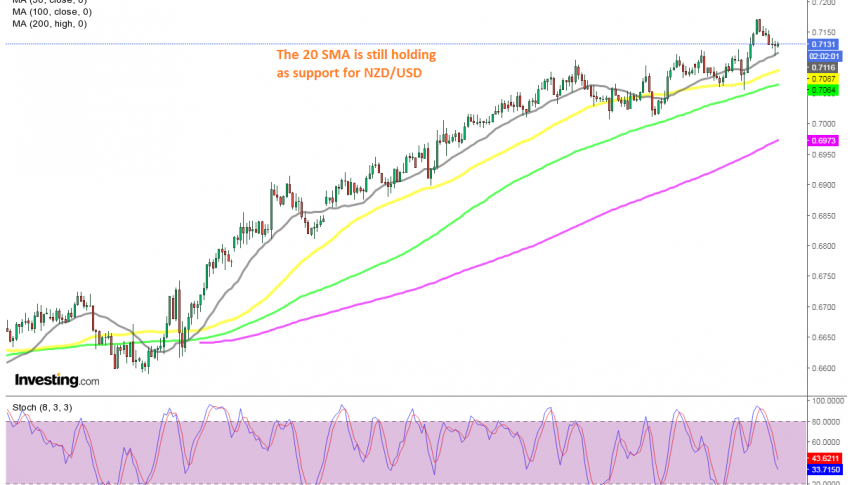
The 50 SMA (yellow) has been the ultimate support, while the 20 SMA (grey) has been holding this pair when the uptrend picked up pace. Earlier this week we saw a bounce off the 50 SMA, while yesterday we saw another retrace down. But it seems like the retrace has ended at the 20 SMA once again.
The 20 SMA held the decline, while the previous candlestick closed as a doji, which is a bullish reversal signal after the retrace down. We are already long on this pair since last night, so we are holding on to our trade, hoping that this pair will bounce off the 20 SMA, since the chart setup points to a bullish reversal.
- Check out our free forex signals
- Follow the top economic events on FX Leaders economic calendar
- Trade better, discover more Forex Trading Strategies
- Open a FREE Trading Account
- Read our latest reviews on: Avatrade, Exness, HFM and XM
Related Articles


Sidebar rates
Related Posts
