USD/CAD Bouncing Between Moving Averages Now
USD/CAD is bouncing between the 100 SMA and the 200 SMA on the H4 chart
The USD/CAD has been trading on a bearish trend since March, when the big bearish reversal in the USD began. The CAD has been benefiting as a commodity currency, and it gained speed after April, when crude oil turned bullish, following the big crash to $ -40 back then.
The Canadian Dollar is positively correlated to the oil prices, and it has been following crude oil higher since April, pushing the USD/CAD lower. By the middle of December, the price fell to 1.2680s, but we saw a retrace higher in the third week of last month, taking the price around 200 pips higher.But the retrace ended and the bearish trend resumed again. The USD/CAD closed 2020 near the lows and the decline resumed as soon as New Year trading started yesterday. The price made new lows, falling to 1.2660 in the Asian session, but during the US session, we saw a strong pullback higher, which sent this pair 140 pips higher. The 50 SMA, which has been working as resistance on the H4 chart, was broken without much trouble, as crude oil lost around $ 2 during a strong pullback down.
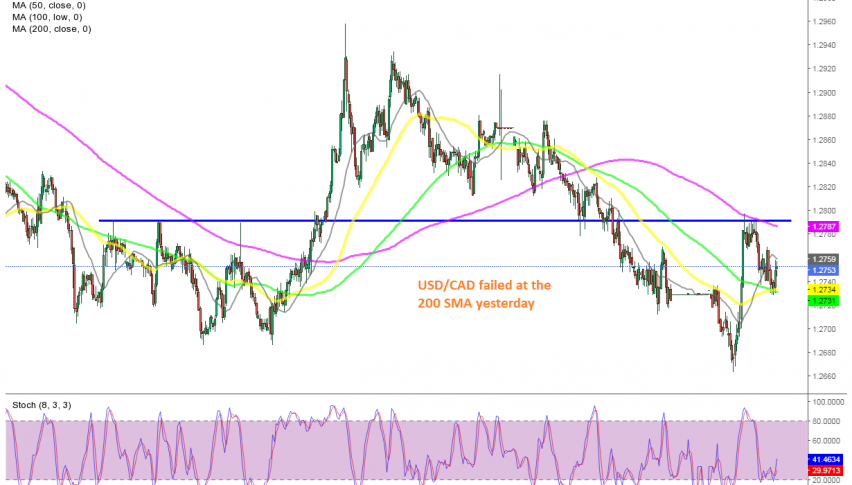
But yesterday, the 200 SMA (purple) turned into resistance on this time-frame chart, rejecting the price in the first attempt. The USD/CAD declined more than 50 pips in the evening, but the 100 SMA (green) turned into support this time. So, the USD/CAD is bouncing between these two moving averages now, and we will try to trade this range, probably selling at the top near the 200 SMA if the bounce off the 100 SMA continues up there.
- Check out our free forex signals
- Follow the top economic events on FX Leaders economic calendar
- Trade better, discover more Forex Trading Strategies
- Open a FREE Trading Account


