Anyone Attempting to Sell Gold at the 20 SMA?
Gold has resumed the decline again, after a short-lived retrace higher
It seems like GOLD has resumed the bearish trend once again. After a two year uptrend, which pushed the price above $ 2,000 for the first time even in the first week of August last year, safe havens reversed in the second week of that month and it seems like the trend has changed for them, particularly for Gold and Silver.
Although, the decline stopped at the 200 SMA on the daily chart at the beginning of December and during last month we saw a retrace higher. That raised questions whether the trend had changed for real, or if it was just a retrace before the long term bullish trend resumed.
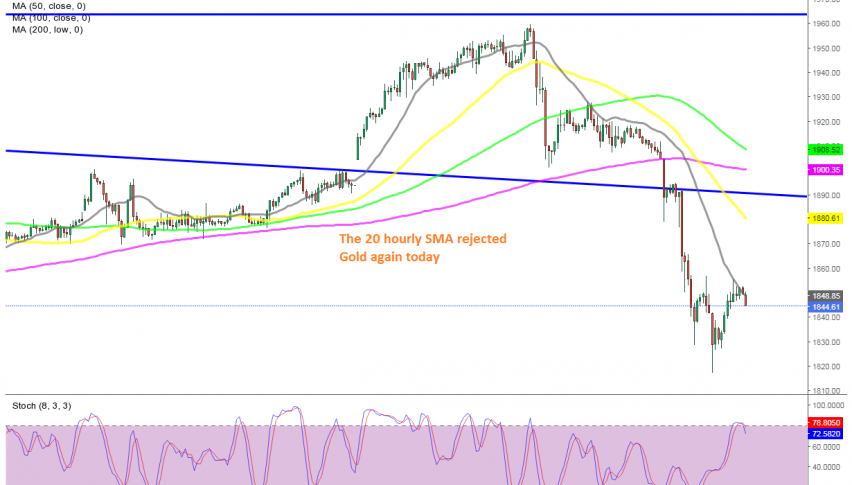
Although, the reversal last week finally gave an answer to that question, with Gold closing that week with a big bearish candlestick. Gold lost nearly $150 last week and it seems like that price action is continuing today as well. We saw a retrace higher in the Asian session this morning, but the retrace ended at the 20 SMA (grey) on the H1 chart and the price has reversed back down, losing around 150 pips. We missed the chance to sell Gold, so well done to those who went short at the 20 SMA. We will wait for another retrace higher, so we can open a sell forex signal here.
- Check out our free forex signals
- Follow the top economic events on FX Leaders economic calendar
- Trade better, discover more Forex Trading Strategies
- Open a FREE Trading Account