Bitcoin Bounces Between MAs Today, After the $ 10,000 Retreat Yesterday
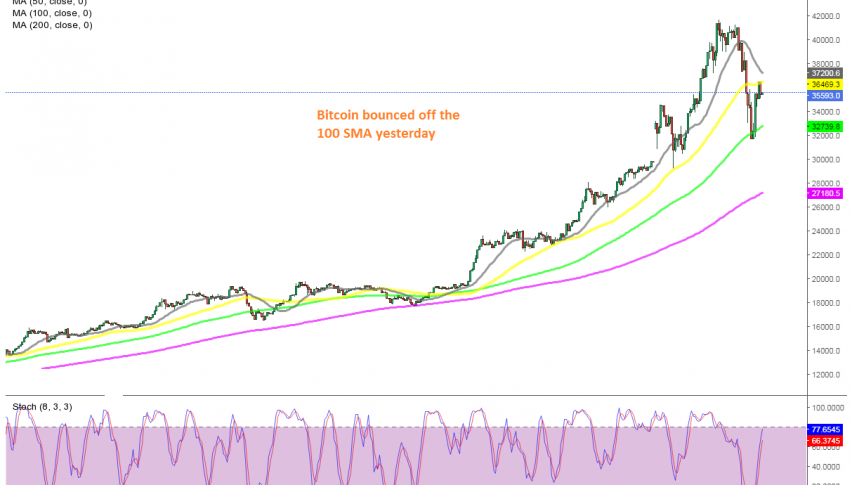
Bitcoin found support at the 100 SMA yesterday, but today the 50 SMA has turned into resistance
Cryptocurrencies have been really bullish since October last year, but the bullish move picked up incredible pace during December and in the first 10 days of January. BITCOIN rallied from $ 17,000 by the middle of December to $ 41,600s by the end of last week.
But, a pullback was on the cards, after the big bullish trend, which actually started last March, following the initial coronavirus crash. Yesterday, the retrace took place, sending Bitcoin crashing down more than $ 10,000. In all other markets, this would be considered a crash, but it doesn’t seem like a crash for Bitcoin, since this decline only makes up a quarter of the value.
Ethereum also retreated lower, from $ 1,350 to $ 970. But, for Bitcoin, the decline stopped at the 100 SMA (green) on the H4 chart. The price bounced around $ 5,000 higher off that moving average overnight, but the 50 SMA (yellow) turned into resistance, and it rejected Bitcoin in the first attempt.
So, it seems like Bitcoin is trading between these two moving averages now. I don’t like selling Bitcoin during a massive bullish period like this, so I would like to see sellers retest the 100 SMA at the bottom and then go long from there, if it holds for the second time. You can follow our live forex signals page, to see if or when we will buy Bitcoin.
- Check out our free forex signals
- Follow the top economic events on FX Leaders economic calendar
- Trade better, discover more Forex Trading Strategies
- Open a FREE Trading Account