Let’s Try an AUD/USD Short at the 50 SMA
AUD/USD has bounced off the 100 SMA, but is finding resistance at the 50 SMA today
Commodity currencies have been surging against the USD like most major currencies, since the Buck has been on a bearish trend for nearly a year. Although the commodity currencies have had another reason to be bullish, which is the rally in commodities.
AUD/USD climbed more than 23 cents from the bottom and during this time moving averages have been doing a great job providing support during pullbacks, pushing the price higher. But, at the end of last week, we saw a retrace lower, which continued yesterday as well.
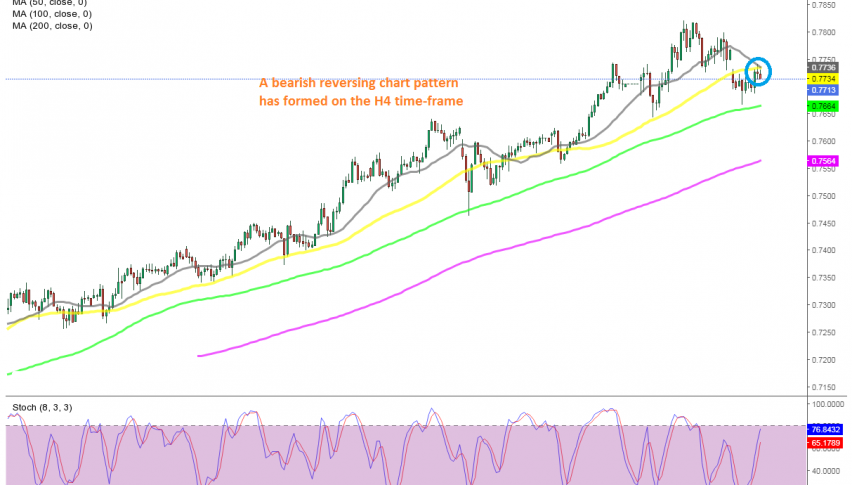
The price slipped below the 50 SMA (yellow) on the H4 chart, but the 100 SMA (green) held as support and the price bounced off that moving average. Although, the 50 SMA seems to have turned into resistance now. The price formed a doji candlestick on this chart, which is a bearish reversing signal.
Besides that, the stochastic indicator is almost overbought on this time-frame, which suggests a bearish reversal as well. So, we decided to open a sell forex signal below the 50 SMA and now it seems like the reversal is taking place. We are holding on to this trade, hoping that AUD/USD will decline to the 100 SMA at least, so we can book profit down there.
- Check out our free forex signals
- Follow the top economic events on FX Leaders economic calendar
- Trade better, discover more Forex Trading Strategies
- Open a FREE Trading Account
- Read our latest reviews on: Avatrade, Exness, HFM and XM
Related Articles


Sidebar rates
Related Posts
