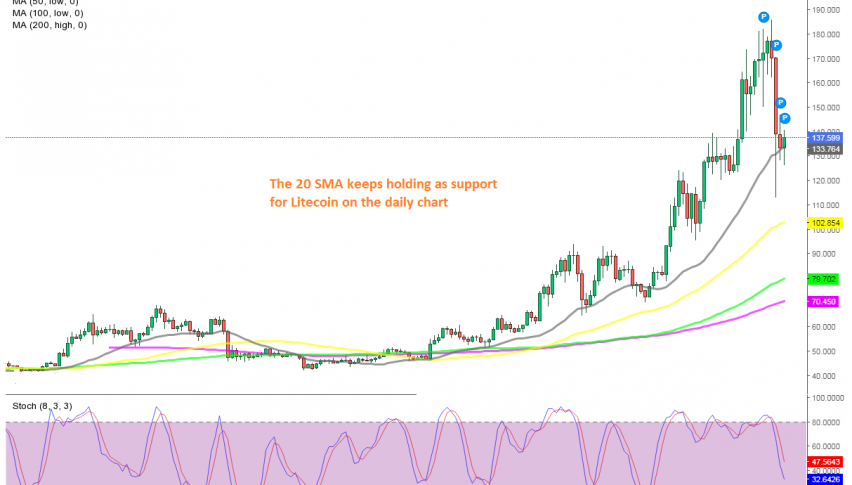
Looking to Buy Litecoin at the 20 Daily SMA, Which Continues to Hold As Support
Litecoin is finding support at the 20 SMA, after the pullback down this week

It seems like the surge in cryptocurrencies has stalled for now. The second “gold rush” for cryptos took place in the last several months pushing BITCOIN to record highs above $ 40,000. ETHEREUM got pretty close to the all-time highs at $ 1,400, but failed to reach them.
Litecoin joined the strong bullish move in cryptos in November, increasing from around $ 50 to $ 185 on Sunday, according to my broker. That was quite a run, but it didn’t approach the all-time highs at $ 420 before the price reversed down on Sunday, which saw Litecoin falling to $ 112.
The price pierced the 20 SMA (gray) on the daily chart, but the daily candlestick closed above it eventually, as the price pulled back up. Yesterday and today sellers have tried the downside again, pushing below the 20 daily SMA, but the price has pulled back up above it now.
This suggests that the 20 SMA is holding as support on the daily chart, and chances are that we might see a bounce from here, as LITECOIN resumes its bullish trend again. So, it looks like a good opportunity to go long on cryptocurrencies now, and we are evaluating a buy position in Litecoin at the 20 SMA. We might go long from here, but will wait for a better entry price lower down, closer to the 20 SMA.
- Check out our free forex signals
- Follow the top economic events on FX Leaders economic calendar
- Trade better, discover more Forex Trading Strategies
- Open a FREE Trading Account


