The 20 SMA Keeping Gold Down
Gold has turned lower after failing tom move above the 20 SMA
Gold has turned bearish since the second week of August, after it broke above the $ 2,000 level, making some record highs last year, as the recession in the global economy sent traditional safe havens higher. But, the crypto market acquired the safe haven status and the traditional ones such as Gold and Silver have lost some of that status, hence the bearish reversal.
Although in December, we saw a bullish reversal again, as the increasing coronavirus restrictions turned traders and investors to safe havens again. But, that bullish reversal turned out to be just another retrace before the bearish trend resumed again.
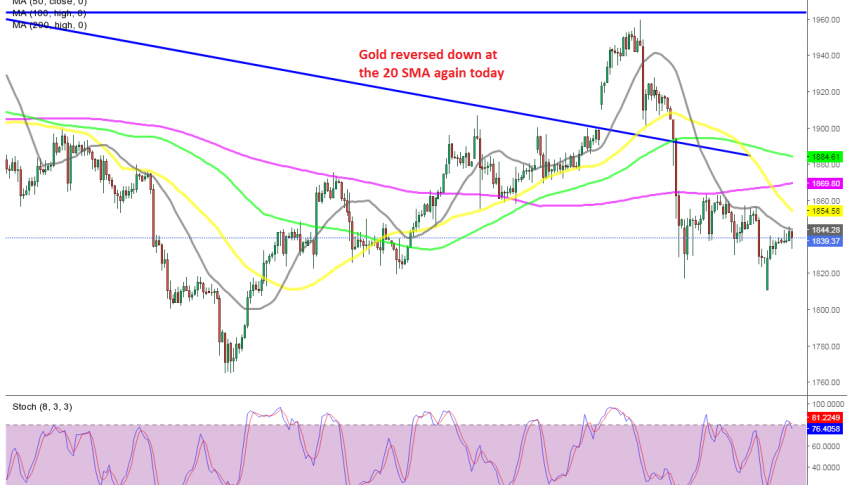
Gold reversed down after the first week of January and it broke below all moving averages on the H4 chart. Now those moving averages turned from support to resistance. The 20 SMA (purple) turned immediately into resistance after being broken, then the 20 SMA (gray) caught up and started providing resistance on this time-frame.
Yesterday Gold retraced higher, but the retrace ended at the 20 SMA again and today the price has reversed back down. So, MAs are keeping Gold down on this time-frame chart and we will try to go short on Gold at some point, probably after another retrace higher to the 20 SMA, which is moving lower.
- Check out our free forex signals
- Follow the top economic events on FX Leaders economic calendar
- Trade better, discover more Forex Trading Strategies
- Open a FREE Trading Account


