Buying USD/CHF Above MAs
USD/CHF is finding support at the 100 SMA again on the H4 chart
The USD/CHF has been bearish for nearly a year, since last March, after the big swing in the previous month. Moving averages have been doing a great job in providing resistance during pullbacks lower and keeping the pressure to the downside for this forex pair.
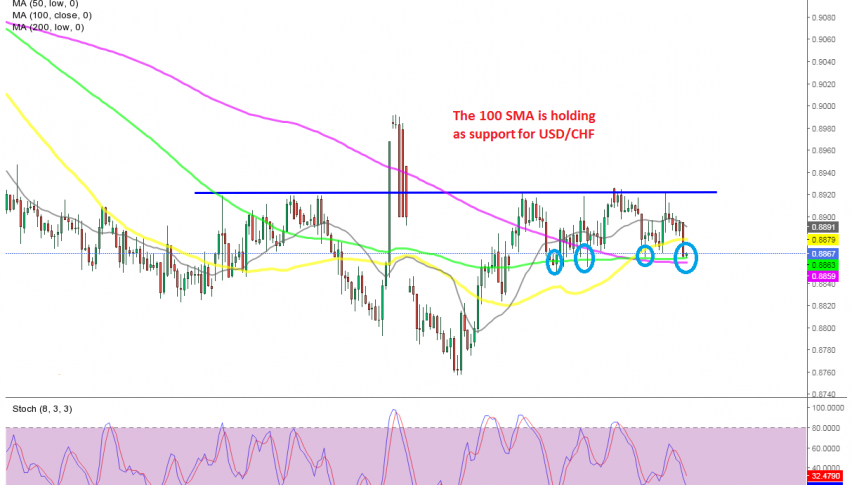
But the decline might have stretched too much after falling to 0.8750s at the beginning of January. Buyers returned and pushed the price above the moving averages on the H4 chart and a resistance zone formed around 0.8920s, while at the bottom, the 100 SMA (green) formed a support zone around the 0.8860 level.
This moving average has been holding as support for more than a week, while the 200 SMA (purple) has joined in, which is adding strength to the decline. The stochastic indicator is also showing that the price is oversold now for the USD/CHF, so we decided to open a buy forex signal above the 100 SMA, hoping for a bounce from there.
- Check out our free forex signals
- Follow the top economic events on FX Leaders economic calendar
- Trade better, discover more Forex Trading Strategies
- Open a FREE Trading Account


