The Range Narrows in Crude Oil Between the 50 MA and the $ 54 Resistance
Crude Oil is forming a triangle, between the resistance and the ascending MAs
Crude Oil has been bullish since April, after coming back form the dead and has put up quite an impressive rally. There was a slight pullback in September and October, but it resume the bullish momentum after the US presidential elections and it broke above the big round level at $ 50.
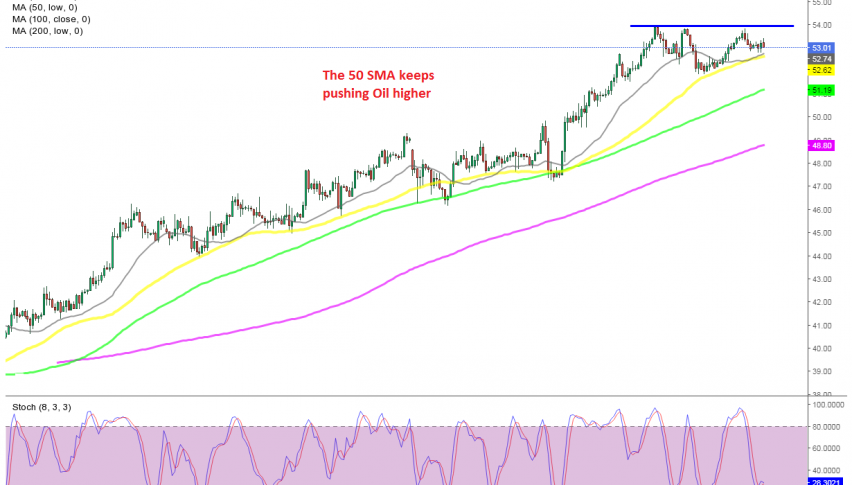
The zone surrounding the $ 50 level didn’t offer much of a resistance, which shows that buyers are in charge in Oil and the buying pressure is quite strong. Although, a resistance zone has formed now below the $ 54 level. The H4 chart above shows that the price has reversed down from there several times in the last two weeks.
Although, moving averages keep providing support at the bottom during pullbacks, pushing it higher. The 50 SMA (yellow) has been the main moving average to work as support, while the 100 SMA (green) has also helped when retraces were deeper.
A triangle seems to be forming for Oil, which might be broken at any time. Right now Oil is heading down, but sellers are reluctant to break the 50 SMA. So, this might be a good chance to open buy forex signal, although we will wait a bit longer and observe the price action. You can follow our forex signals section for live crude Oil signals.
- Check out our free forex signals
- Follow the top economic events on FX Leaders economic calendar
- Trade better, discover more Forex Trading Strategies
- Open a FREE Trading Account
- Read our latest reviews on: Avatrade, Exness, HFM and XM
Related Articles


Sidebar rates
Related Posts
