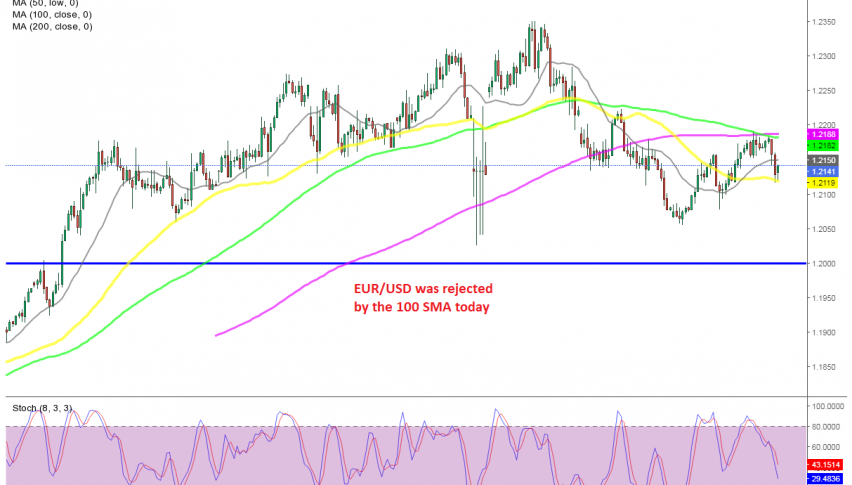
EUR/USD has been bullish since May last year, after the European Central Bank (ECB) announced it would start the PEPP programme to help fight the coronavirus effects. There was a retreat during September and October, after the failure to break the big round support area at 1.20, but then the bullish trend resumed again after the US presidential elections.
The resistance zone surrounding 1.20 broke eventually in December and buyers pushed this pair to 1.2350s. Although after the first week of this year, we saw a bearish reversal and EUR/USD lost around 300 pips. Last week we saw a bullish reversal and the price has been climbing higher, but this looks more like a retrace.
The 100 SMA (green) turned from support to resistance in the second week of January and it is acting as resistance again now, having rejected EUR/USD earlier today. It was aided by the 200 SMA as well today. The price declined around 80 pips after the rejection, but the 50 SMA (yellow) is acting as support now. EUR/USD has bounced a bit off that moving average, but is not too far from it. We are thinking of going long perhaps, with a small buy signal, but will see how the price reacts now.


