Is the Bullish Retrace Over in the EUR/USD?
EUR/USD reversed lower yesterday, after failing at the 20 SMA last Friday
The EUR/USD has been bullish since May last year, after the European Central Bank (ECB) announced that it would start the PEPP program to help fight the effects of the coronavirus. There was a retreat during September and October, after the failure to break the big round support area at 1.20, but then the bullish trend resumed again after the US presidential elections.
The resistance zone surrounding 1.20 broke eventually in December, and buyers pushed this pair to 1.2350s. Although after the first week of this year, we saw a bearish reversal and the EUR/USD lost around 300 pips. But the decline ended at the 50 SMA on the daily chart last Monday, and last week we saw a bounce.
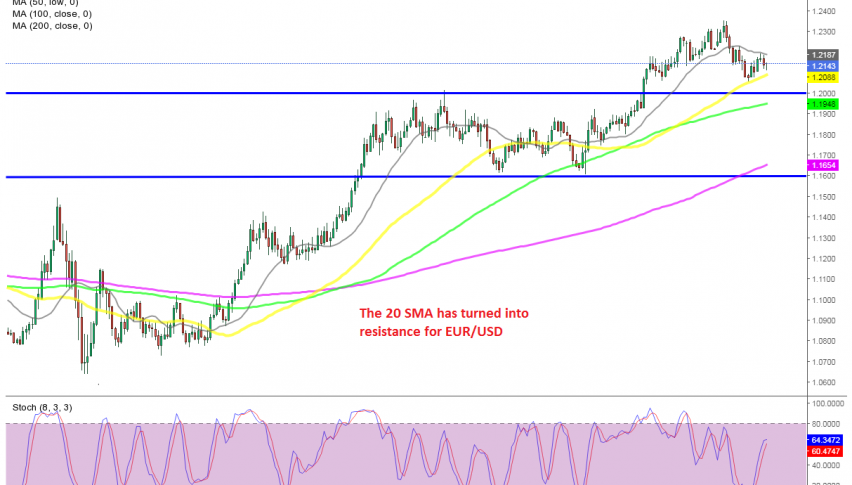
Then the price climbed higher, but this looks more like a retrace now. The 20 SMA (gray) seems to have turned into support, rejecting the price. On Friday the EUR/USD formed a doji candlestick, which is a bearish reversing signal after the climb. Yesterday the price reversed down and the daily candlestick looks bearish now.
So a bearish reversing pattern has formed on the daily chart in this pair. This suggests that the larger bullish trend might have stalled for now, although we will see if sellers are able to break the 50 SMA. If they do, then the decline will continue further, probably to 1.20, so we will try to play the downside in the EUR/USD.
- Check out our free forex signals
- Follow the top economic events on FX Leaders economic calendar
- Trade better, discover more Forex Trading Strategies
- Open a FREE Trading Account


