Moving Averages Continue to Keep Crude Oil Bullish
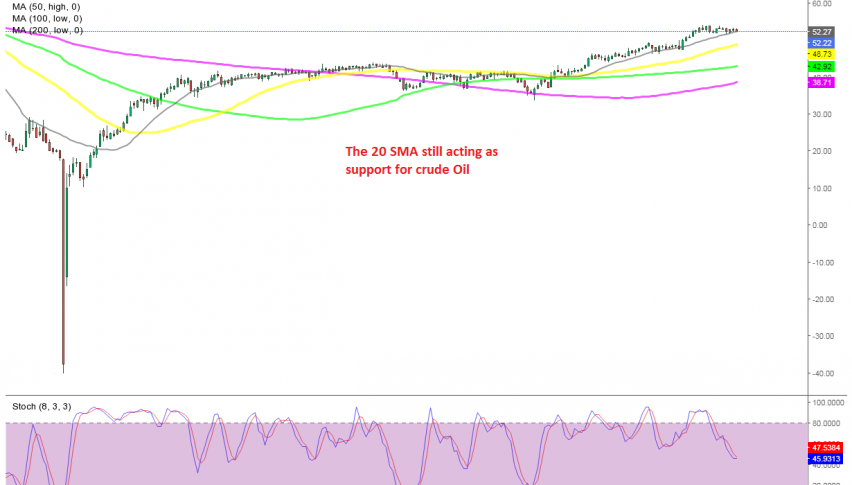
Crude Oil has retraced lower this week, but the 20 SMA is still acting as support
Crude Oil started 2020 on a bearish foot but ended it on a quite strong bullish momentum. The US-Iran tensions and the coronavirus breakout in China sent it lower at first. Then the decline picked up speed when coronavirus traveled to Europe and other place of the world, sending US WTI crude Oil to $ -37.50 by April, with the help of Saudis who flooded markets with cheap Oil.
But by the middle of April the situation reversed and Oil has been bullish since then. During the decline, moving averages such as the 20 SMA (gray) were acting as resistance on the daily chart, then after the reversal they turned into support, pushing crude Oil higher.
All the moving averages have helped during pullbacks lower, but the 20 SMA in particular has been doing a good job in the last two month, indicating that the trend has picked up pace. Right now US WTI Oil is trading around this moving average again and the stochastic indicator is becoming oversold, so the retrace down is becoming complete. We might go long on Oil if we get a bullish reversing signal candlestick.
- Check out our free forex signals
- Follow the top economic events on FX Leaders economic calendar
- Trade better, discover more Forex Trading Strategies
- Open a FREE Trading Account


