The 100 SMA Holds As Support for Ethereum at First Attempt
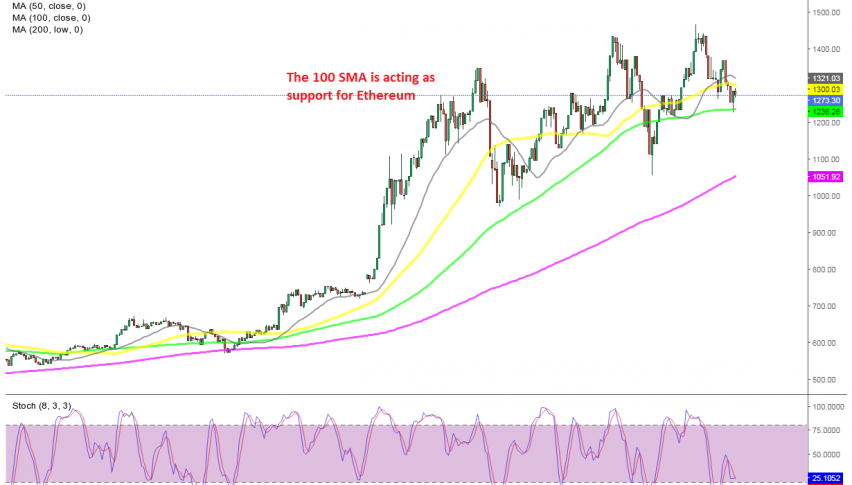
Ethereum is finding support at the 100 SMA on the H4 chart
Cryptocurrencies have been extremely bullish since summer last year and the upside momentum became stronger towards the end of 2020 and in the first week of the new year. Some cryptos such as Bitcoin have been retreating lower in the last few weeks, while others continue to march higher.
One of those altcoins which has been continuing its journey higher is ETHEREUM . Ethereum made some new highs earlier this month, as it climbed above $ 1,430. It retreated around $ 400 lower, but last week it resumed the bullish trend, pushing even higher.
The last high was at $ 1,465, although this week we are seeing another retrace lower in ETH/USD. This digital currency lost nearly $ 400, but the decline stalled at the 100 SMA (green) on the H4 chart. There is a small bounce, but the price is not running away.
This might be a good chance to go long on Ethereum, but there is still a lot of room on the daily chart for further declines, so we will hold on for now. If the price declines to around $ 1,050 then we will try to open a buy Ethereum signal.
- Check out our free forex signals
- Follow the top economic events on FX Leaders economic calendar
- Trade better, discover more Forex Trading Strategies
- Open a FREE Trading Account