Pressure is Turning to the Downside in Bitcoin, as MAs Turn From Support to Resistance
Bitcoin has been slipping lower and moving averages are providing resistance now

It seems like the trend has changed in Bitcoin for the time being. Bitcoin turned really bullish in 2020, as the cryptocurrency market, and Bitcoin in particular, earned the status of safe haven assets, at a time when everything became too dangerous to buy in financial markets, with the world order changing and every thing that we witnessed last year.
Buyers were in charge the whole time, and towards the end of the year, the crypto market surged higher, with Bitcoin breaking above the previous high at $ 20,000, while in early January, Bitcoin moved above $ 40,000. But about a week into 2021, the price reversed down.
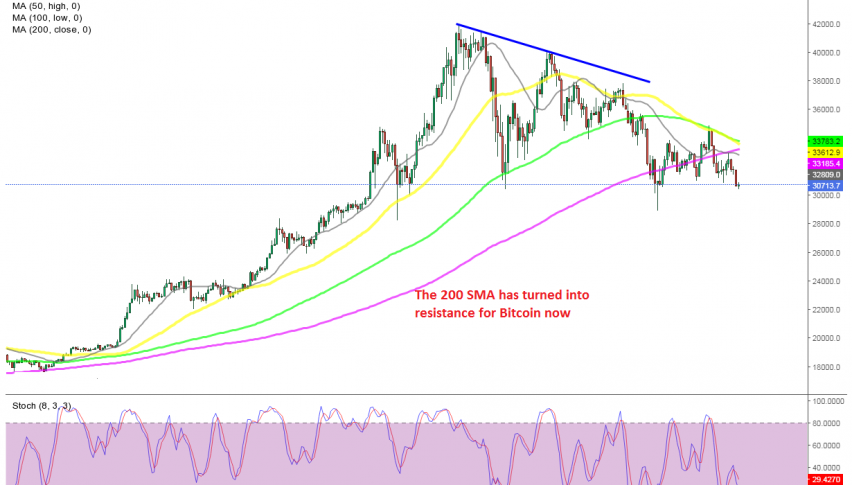
During the uptrend, moving averages were providing support on pullbacks lower, the smaller ones when the trend was stronger and the larger ones when the trend slowed down and retraces became deeper. In the first pullback, the 100 SMA (green) held the decline, and we saw a bounce from there.
The price moved above the 50 SMA (yellow), which gave the impression that the bullish trend would continue further. But, the price reversed below the previous high and has been making lower highs since then, suggesting that sellers are in charge now. Lows have gotten lower as well, with the price falling to $ 29,000 last week, while moving averages have turned into resistance on the H4 chart.
The price reversed at the 100 SMA in the last retrace higher, and now it’s heading down again. The pressure remains to the down side in Bitcoin, so we won’t try to buy Bitcoin right now, until the trend changes again and moving averages turn from resistance to support
- Check out our free forex signals
- Follow the top economic events on FX Leaders economic calendar
- Trade better, discover more Forex Trading Strategies
- Open a FREE Trading Account


