The 20 SMA Turns into Resistance for USD/CHF
USD/CHF buyers tried to resume January's bullish trend, but the 20 SMA stopped the climb
The CHF has been mostly following the Euro for about a year, with the price bouncing in a tight range between 1.0750 and 1.085, apart from October when it dived 100 pips lower to 1.0650. EUR/USD has been bullish, which means that USD/CHF has been bearish during this time.
USD/CHF was trading at 0.99 in March last year, while it fell to 0.87.50s in the first week of January, which means more than 11 cents lower. In the second week of last month, we saw a retrace higher in this pair, which is why the H4 chart looks bullish, but on the daily chart this seems like a retrace of the bigger bearish trend.
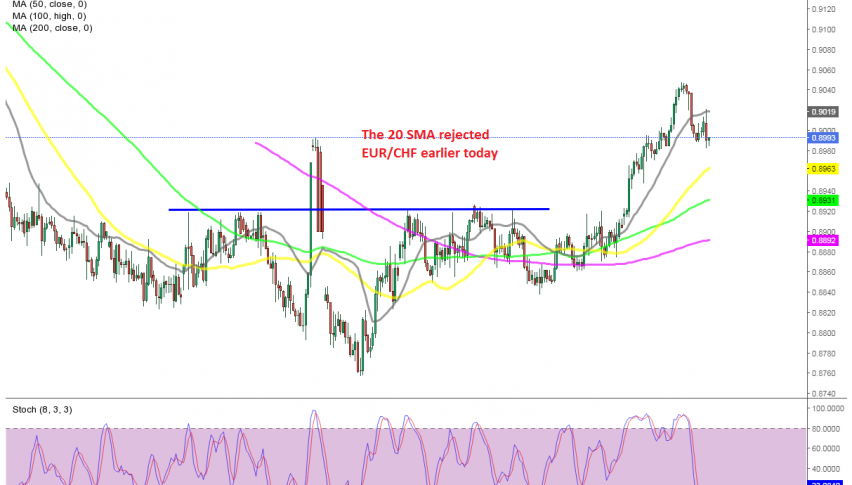
Besides that, the climb stopped at the 100 SMA on the daily chart on Thursday and on Friday we saw a reversal from there. Today we saw an attempt from buyers to resume the bullish momentum after the decline last Friday, but the 20 SMA (gray) turned into resistance in the H4 chart.
It rejected the price and this pair fell 40 pips lower. So, January’s retrace higher on the daily chart might be over, but the price is not running anywhere now. It has stalled just below 0.90, so let’s see if buyers will have another attempt, perhaps tomorrow.
- Check out our free forex signals
- Follow the top economic events on FX Leaders economic calendar
- Trade better, discover more Forex Trading Strategies
- Open a FREE Trading Account


