Is the Climb in Gold Over?
Gold has retraced higher for a few days, but the retrace might be over at the 100 SMA

In the larger time-frame charts, gold has turned bearish since August, after surging as a safe haven during the first few months of the coronavirus. But cryptocurrencies acquired safe haven status last year, entering this market with big stamina, and stealing some of the shine from the traditional safe havens.
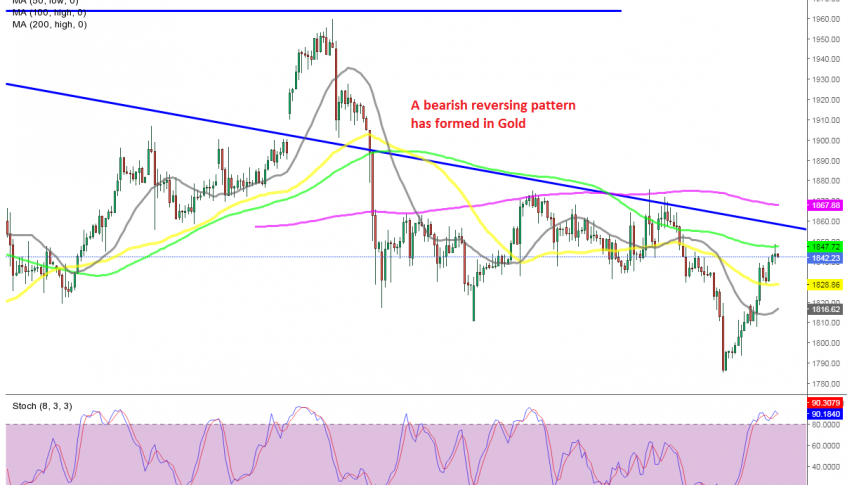
During this time, we have seen some decent pullbacks higher, but they have been met by a number of sellers who have turned the price bearish again, pushing GOLD lower. In the last few trading days, we have seen another retrace higher, but this retrace might be coming to an end soon.
We see on the H4 chart above that moving averages were doing a good job as support in December, when gold was bullish, but they turned into resistance when the trend turned bearish again. Now, it seems like the 100 SMA (green) might be turning into resistance again, since the climb stopped right below it.
The previous H4 candlestick closed as a doji, which is a bearish reversing signal after the bullish move, and the stochastic indicator is overbought. This might be a good opportunity to sell gold, targeting around 600 pips lower, but we will follow the price action a bit longer and then decide whether to go short in gold.
- Check out our free forex signals
- Follow the top economic events on FX Leaders economic calendar
- Trade better, discover more Forex Trading Strategies
- Open a FREE Trading Account


