Bearish Reversal Confirmed in USD/JPY, As the 50 SMA Turns From Support to Resistance
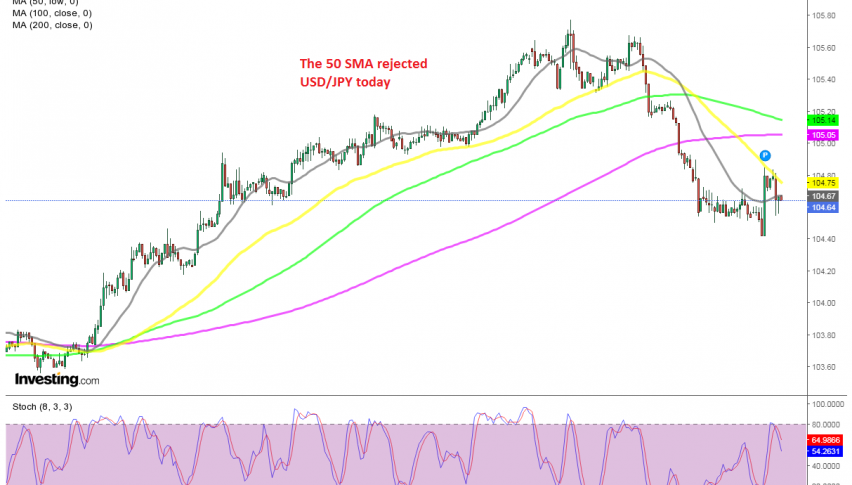
USD/JPY tried to turn bullish today, but the 50 SMA stopped the jump
USD/JPY used to be bearish since it reversed down in the last week of March last year. During this time, USD/JPY lost around 9 cents, with moving averages keeping it down on the daily chart, particularly the 50 and 100 SMAs.
But, in the second week of January we saw a bullish reversal, which took the price above these moving averages, which used to be the ultimate resistance indicators for this pair. That was an indication that the long term bearish trend might be over, since the 50 SMA turned from resistance to support.
USD/JPY climbed more than 3 cents higher, moving above 105, but the 200 SMA on the daily chart brought an end to that bullish move. This pair reversed down on Monday and it has been declining since then. So, the bullish retrace was over.
Although we saw a jump earlier today, but the 50 SMA (yellow) which used to act as support on the H1 chart when the price was bullish, now turned into resistance. So, that confirms that the pressure has shifted to the downside now.
- Check out our free forex signals
- Follow the top economic events on FX Leaders economic calendar
- Trade better, discover more Forex Trading Strategies
- Open a FREE Trading Account


