⚡Crypto Alert : Altcoins are up 28% in just last month! Unlock gains and start trading now - Click Here

EUR/USD Waiting at the 50 SMA Ahead of the ECB
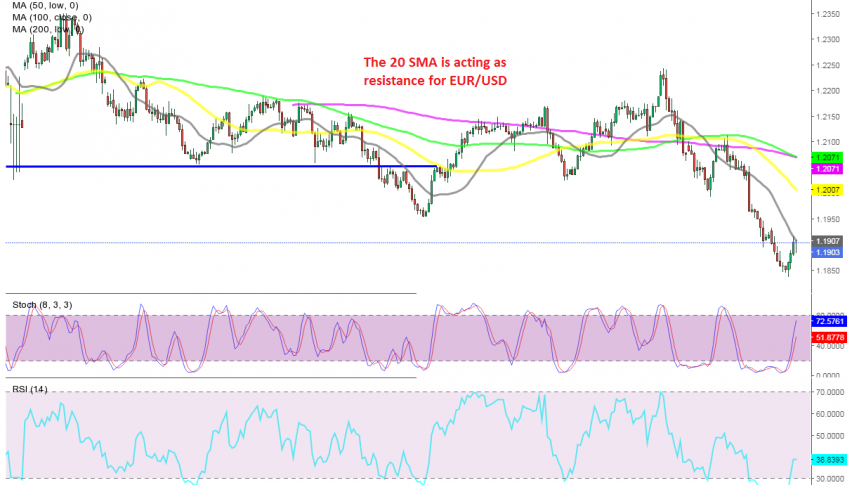
EUR/USD turned bearish in February, as the decline in the USD ended after about a year and the surge in this pair ended at 1.2350s. Although, the decline picked up pace in March and EUR/USD fell below 1.19.
But, in the last two days we have seen this pair retrace higher, which has taken the price around 200 pips higher. Buyers found resistance at the 20 SMA (gray) on the H4 chart initially, but pushed above it yesterday.
Today, the 50 SMA (yellow) is acting as resistance on the H4 chart, after this pair popped higher earlier this morning. The European Central Bank interest rate decision and statement will be releases soon, so let’s see where they will take the Euro.
Check out our free forex signals
Follow the top economic events on FX Leaders economic calendar
Trade better, discover more Forex Trading Strategies
Related Articles
Comments
Subscribe
Login
0 Comments


