More Signs That the US Economy Is Leading the World, As Data Keeps Getting Better
It seems like the US is experiencing an economic boom

The US economy was the first to bounce back post the first lockdowns in Spring last year. Manufacturing activity bounced back and kept growing. Services were slow to bounce, with the social unrest in summer last year, which is still going to some degree in certain areas.
But, services caught up with manufacturing and are expending by the fastest pace in quite a long time. Now with the new stimulus package, the situation is getting even better, despite restrictions still in place in some states.
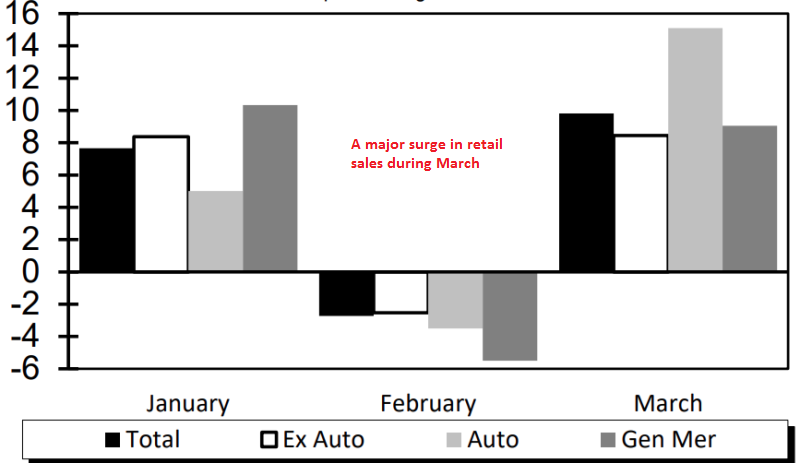
Today’s data was quite impressive as well, especially the retail sales, which surged in March. Inflation is also growing, so the FED will start to acknowledge the economic boom soon. That’s when the USD will start to turn really bullish in the long run.
March US Retail Sales Report
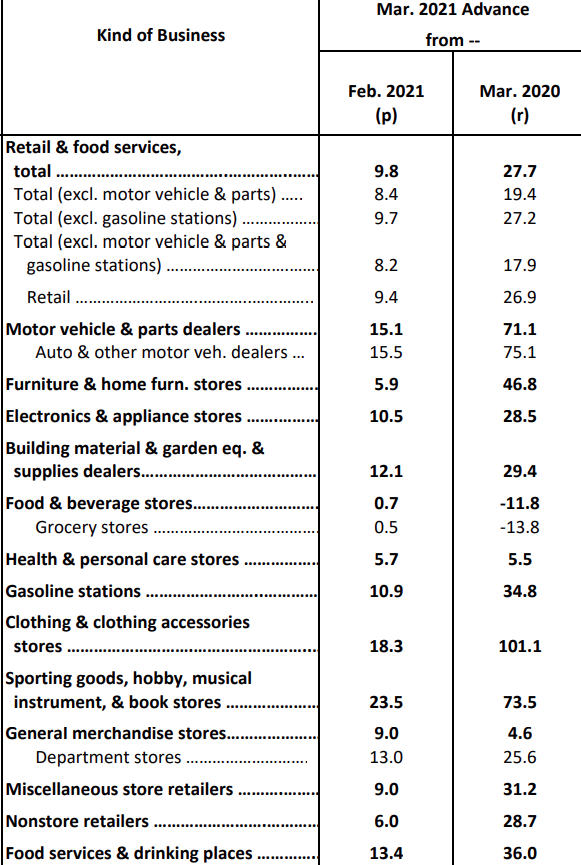
- March advance retail sales +9.8% vs +5.8% expected
- Prior was -3.0%
- Retail sales ex auto +8.4% vs +5.0% expected
- Retail sales ex auto and gas +8.2% vs +6.4% expected
- Retail sales control group +6.9% vs +7.2% expected
- Sales up 14.3% from the same period a year ago vs +6.3% prior
- Motor vehicle sales and parts +15.1% m/m
- Full report
Prior numbers and revisions
- February retail sales -3.0% (revised to -2.7%)
- February retail sales ex auto and gas -3.3% (revised to -3.1%)
- February retail sales control group -3.5% (revised to -3.4%)
The headline is extremely strong but some of that was baked in after a jump in new car sales in the month that should have already been priced in. The control group metric is better at stripping out some of the one-off metrics and it was a tad below consensus so that almost balances it out.

US April 2021 Empire Fed Manufacturing Index

- April Empire Fed manufacturing +26.3 vs +20.0 expected
- Prior was +17.4
- New orders +26.9 vs +9.1 prior
- Prices paid +74.7 vs +64.4 prior (highest since 2008 when it peaked at 77.9)
- Prices received +34.9 vs +23.9 (record high since survey began in 2000)
- Six month conditions +39.8 vs +36.4 prior
- Employment +13.9 vs +9.4 prior
This is a great report but that jump in prices paid is going to get the market’s attention. What’s encouraging for the longer term is that the capital expenditure index continues to trend higher and is not far off the best levels since 2005.

US Initial Jobless and Continuing Claims Current Week
- Initial jobs claims 576K versus 700 K estimate. The claims fell 193K from last weeks 769K last week (was 744K).
- Four-week moving average of initial claims 683K versus 730.25K last week
- Continuing claims 3731K versus 3700K estimate
- Four-week moving average of continuing claims 3763K vs 3861K last week
- During the week ending March 27, 51 states reported 7,053,575 continued weekly claims for Pandemic Unemployment Assistance benefits and 51 states reported 5,160,267 continued claims for Pandemic Emergency Unemployment Compensation benefits.
- The largest increases in initial claims for the week ending April 3 were in California (+39,136), New York (+16,771), Oklahoma (+4,615), Michigan (+3,364), and Tennessee (+3,257),
- The largest decreases were in Alabama (-13,318), Ohio (-9,358), Georgia (-5,659), Kentucky (-3,415), and Texas (-3,325)
- Check out our free forex signals
- Follow the top economic events on FX Leaders economic calendar
- Trade better, discover more Forex Trading Strategies
- Open a FREE Trading Account


