Ethereum Price Forecast – Upward Channel Breakout, Quick Technical Outlook!
ETH/USD is trading with a strong bullish bias at 2,452, facing immediate resistance at 2,550. Continuation of further upward trend and
The ETH/USD crypto pair managed to extend its previous positive performance and remained bullish around above the mid-$2,400 level. Earlier in the day, Ethereum broke the $2,500 level and hit the new all-time high at $2,544. There was a bearish change below the $2,500 level, similar to BITCOIN. The Ethereum sellers were able to push the price below the $2,480 support level. The price even broke the 50% Fib retracement level of the upward wave from the $2,406 swing low to $2,548 high. As of now, the ETH/USD price is approaching the $2,425 support level. It tests the 76.4% Fib retracement level of the upward wave from the $2,406 swing low to $2,548 high.
There is also a key rising channel forming with support near $2,425 on the crypto pair’s hourly chart. If there is a downside break below the channel support, the ETH/USD pair price could drop towards $2,350. The 100 hourly simple moving average is also near the $2,350 level to provide support. If the losses do not stop, it might call for a move towards the $2,300 level in the near term. The next significant support is near the $2,200 level (the last major breakout zone).
On the bullish side, if ETH/USD stays above the channel support, it could mark the fresh rise above $2,450. An initial resistance on the upside is near the $2,500 level. A successful break above the $2,500 level could start a move towards the $2,550 level. Further gains will set the pace for a test of $2,600 or even $2,660 in the coming sessions.
At the USD front, the broad-based US dollar succeeded to stop its early-day declining streak and rose higher ahead of the European session as investors started to favor the safe-haven assets in the wake of risk-off market sentiment. However, the US dollar gains were further bolstered by the better-than-expected U.S. economic data. Thereby, the upticks in the US dollar became the key factor that kept the lid on any additional gains in Ethereum prices.
ETH/USD Daily Support and Resistance
S1 2275.05
SU.S.2372.06
S3 2436.19
Pivot Point 2469.07
R1 2533.2
R2 2566.08
R3 2663.09
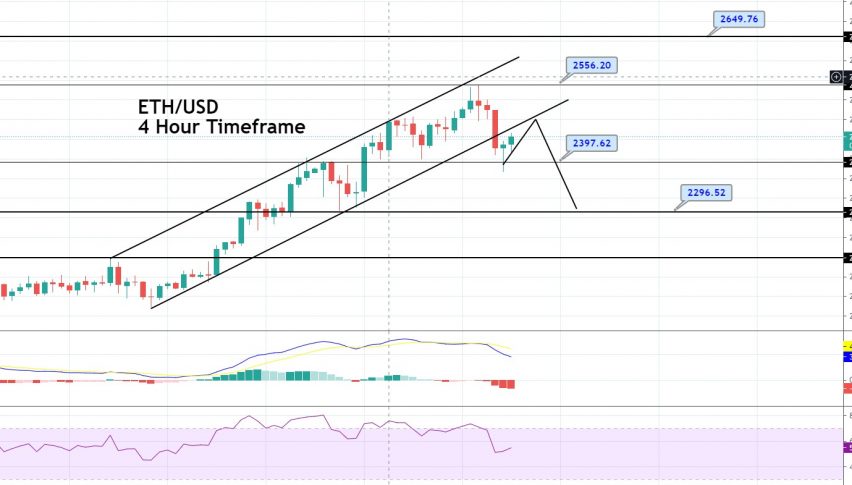
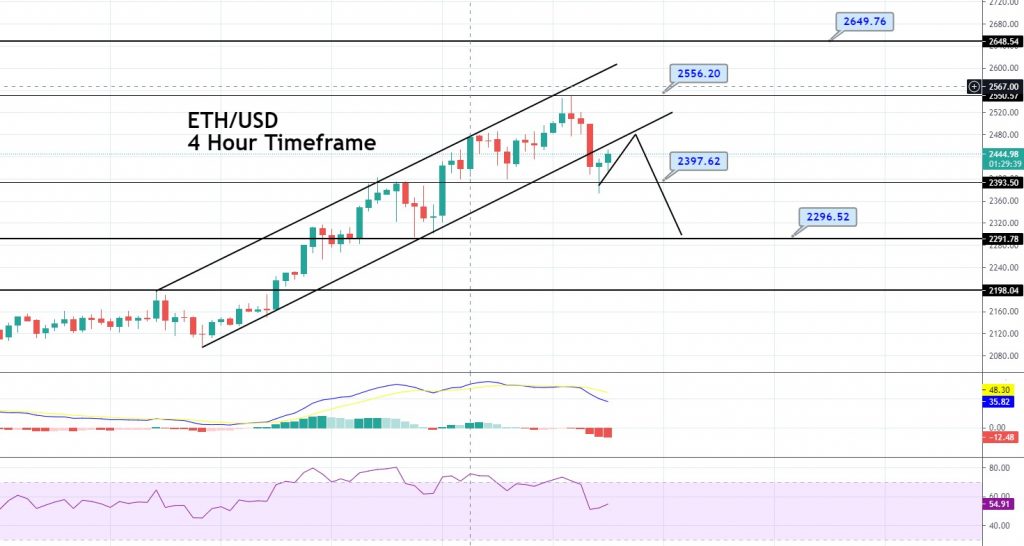
ETH/USD is trading with a strong bullish bias at 2,452, facing immediate resistance at 2,550. Continuation of further upward trend and violation of 2,550 level can extend buying trend until 2,640 level. The 20 and 50 periods EMA are supporting bullish trend, along with the MACD and RSI. ETH/USD has violated the support level of 2,440, and now the same level is working as a resistance. Below this, the pair is likely to gain support at 2,397, and violation of this can drive further selling until 2,296. Good luck!
- Check out our free forex signals
- Follow the top economic events on FX Leaders economic calendar
- Trade better, discover more Forex Trading Strategies
- Open a FREE Trading Account