Is the Pullback Over in USD/JPY?
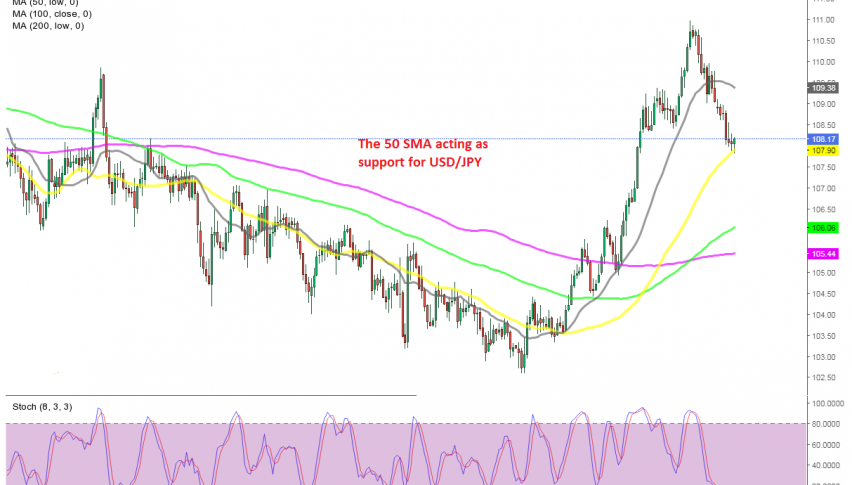
USD/JPY is oversold on the daily chart now, after the latest retreat lowd
[[USD/JPY-sponsored]]
USD/JPY turned into one of the most bullish pairs since early January this year. This pair surged around 8.5 cents higher until the end of March, which showed that weakness in the JPY, given that losses in other major currencies against the Buck this year were much smaller.
Although, traditional safe havens have been quite weak, since they are losing some of that status, which has been transferred to cryptocurrencies, as we explained in the Gold forecast for 2021. Hence the weakness in the JPY and GOLD this year. Although, during April we have seen a bullish reversal in traditional safe havens, with Gold climbing around $120, while USD/JPY has lost more than 300 pips.
But, the decline in this pair might have come to an end, as the daily chart above suggests. The stochastic indicator is severely oversold and it’s starting to turn higher, while the 50 SMA (yellow) is acting as support now on this time-frame chart.
Besides that, yesterday’s candlestick closed as a doji, which is a bullish reversing signal after the decline. Today’s candlestick looks bullish already, although it is still too early until the end of the day. So, this looks like a good opportunity to go long on this pair. We are watching how this pair behaves down here and might open a long term buy signal, so follow our forex signals page for live trade ideas.
- Check out our free forex signals
- Follow the top economic events on FX Leaders economic calendar
- Trade better, discover more Forex Trading Strategies
- Open a FREE Trading Account


