Attempting to Sell Gold, With the Retrace Higher Complete on the Daily Chart
Gold has formed a bearish reversing pattern on the daily chart
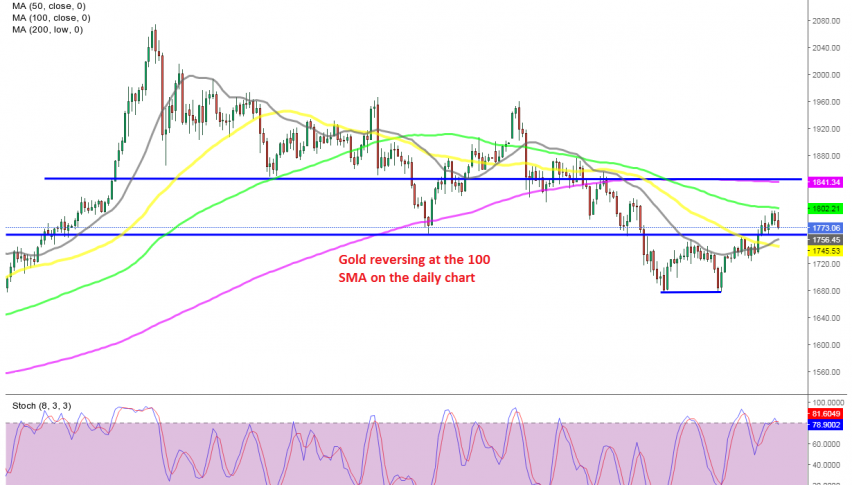
Gold turned bearish in August last year, after being bullish for two years, trading at record highs above $2,000 . It fell around $400 until the end of March, as traditional safe havens lost the appeal, as cryptocurrencies took over this status, after everything that has been going on around the world since early 2020.
As a result, GOLD remained bearish until the end of last month, but turned bullish this month. The 20 SMA (gray) held as resistance in the first attempt by the middle of March, but the price formed a double bottom at around $1.675 and Gold bounced off that area.
The 50 SMA (yellow) provided resistance for some time, but that moving average ws broken as well and the price continued higher to $1,798, just below the next big round level at $1,800 where the 100 SMA stands on this chart.
Today Gold retreated back down quite hard, in the last few hours, after retesting and failing below the 100 SMA. Now Gold has lost nearly 250 pisp. This suggests that the selling pressure is quite strong up there.

The 20 SMA is acting as resistance on the weekly chart
The pullback higher also seems complete on the daily time-frame, with the stochastic indicator overbought and turning lower now. On the weekly chart above, the price is still not overbought and the 50 SMA (yellow) looks a better place to go short, since the stochastic indicator would be overbought by then.
But, the 20 SMA is acting as resistance now and buyers are finding it hard to push above $1,800. On the other hand, the daily chart is pointing to a bearish reversal, so this is a bit of a tough decision to make, but we will make up our mind soon, so please follow our forex signals page for live Gold signals.
- Check out our free forex signals
- Follow the top economic events on FX Leaders economic calendar
- Trade better, discover more Forex Trading Strategies
- Open a FREE Trading Account