Is Ripple (XRP) Getting Ready to Test $2 Again?
Early on Tuesday, Ripple appears to have resumed its uptrend after rebounding strongly from the $1 level and making its way towards $1.50.
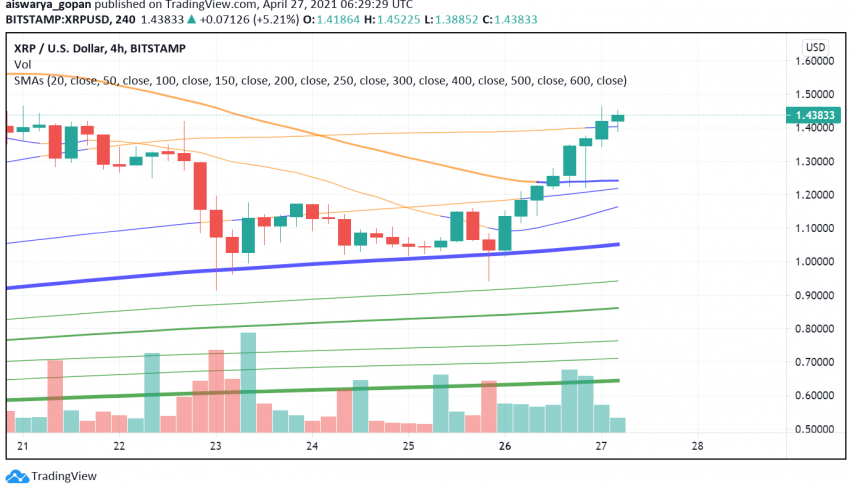
Early on Tuesday, Ripple appears to have resumed its uptrend after rebounding strongly from the $1 level and making its way towards $1.50. During the previous session, XRP/USD registered more than 31% of gains, rising above the key support provided at $1 as Bitcoin prices returned above the key $50,000 level, boosting investor confidence in the overall crypto market.
At the time of writing, XRP/USD is trading at around $1.43. Technical indicators are supporting a continuation and strengthening of the recent bullish momentum, with the 100 SMA offering the next key resistance. Overcoming this hurdle can easily take this cryptocurrency on its way towards achieving and crossing the $2 level.
On the fundamentals’ side, the SEC lawsuit remains in focus, with the Commission filing a motion to dismiss the company’s defence about lack of due process and fair notice that the transactions of XRP were violating any law. The court filing indicates SEC’s stand that it did not have any legal obligation to warn Ripple prior to the lawsuit on the activities it deemed as illegal.
The lawsuit will be a key turning point in the overall crypto industry irrespective of its outcome as it can potentially pave the way towards regulating digital assets going forward. Even though the SEC has maintained that it does not consider Bitcoin and Ethereum as securities, its outlook towards XRP could be extended to other cryptocurrencies and bring them under some form of regulation.
Key Levels to Watch
To continue with its uptrend, traders will have to keep Ripple’s price above the $1.40 level and then break past resistance at $1.48 which can then open the door towards the next key level at $1.78. However, if the resistance holds and buyers are unable to build up enough pressure, XRP price can easily fall back down to $1.16 and further down towards $1 once again.
- Check out our free forex signals
- Follow the top economic events on FX Leaders economic calendar
- Trade better, discover more Forex Trading Strategies
- Open a FREE Trading Account