Ripple Price Forecast – Symmetrical Triangle Pattern, Breakout Eyed!
The XRP/USD was closed at 1.65196 after placing a high of 1.65196 and a low of 1.55067. XRP/USD extended its gains over the weekend and reac
XRP/USD closed at 1.65196 after placing a high of 1.65196 and a low of 1.55067. XRP/USD extended its gains over the weekend and reached above 1.65 level. The recent surge in Ripple was caused by the recent comments from Ripple CEO Brad Garlinghouse. He said that the lack of clarity in the U.S. regulation of cryptocurrencies was frustrating. He added that United States was the only country claiming that XRP was security and not a currency.
As the cryptocurrency industry has picked up pace, global regulators have also begun discussing the legislative framework that should be established. According to Garlinghouse, some countries have been at the forefront with a more open-minded approach but some countries like the U.S. have fallen behind. He continued criticizing the U.S. for its lack of decisive actions in terms of crypto-regulations and took the opportunity to blast the nation’s financial watchdog for its assertion that XRP was a security. The Securities and Exchange Commission alleged the payment processor of conducting an unregistered security offering for the Ripple (XRP) token. As both parties are battling it out in a courtroom, other nations have refused to go down that road and assert that Ripple’s native digital token was a currency.
XRP/USD Daily Technical Levels
1.58444 1.68573
1.51691 1.71949
1.48315 1.78702
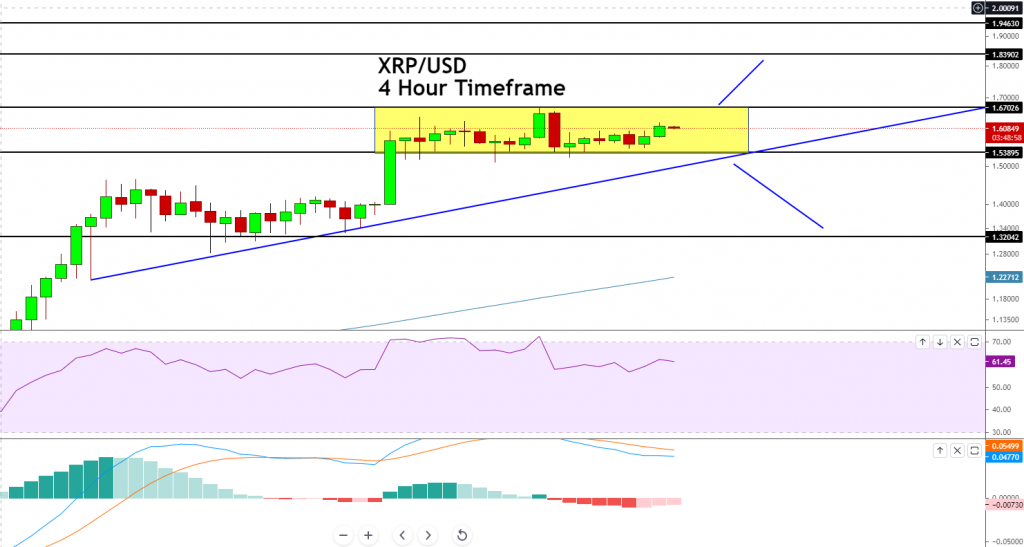
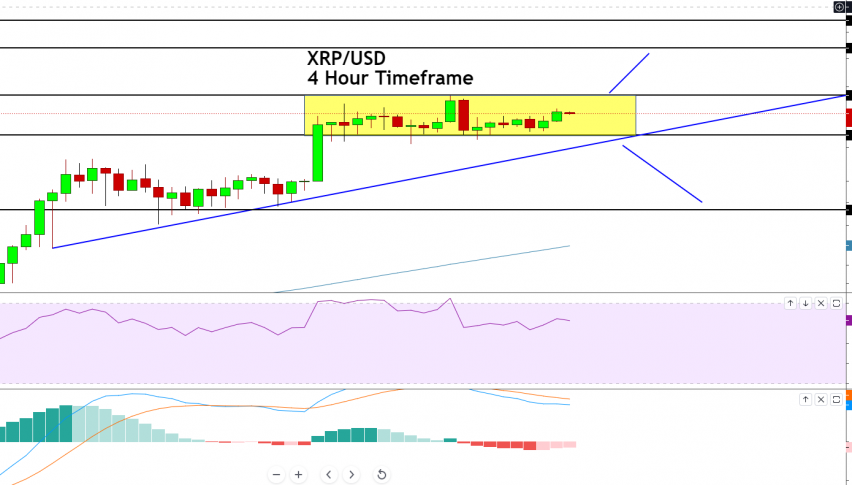
Pivot Point: 1.61820XRP/USD is consolidating in a sideways channel that’s keeping it on hold at 1.6090 level. The channel extends resistance on the upper boundary of 1.6703 level along with a support level of 1.5389. Investors are keeping a close eye on this range as the breakout of this range may help us capture a nice trade. For instance, violation of the 1.6702 level can extend buying trend until 1.83, and a bearish breakout can lead to 1.5389 level towards 1.4100 level. Let’s keep an eye on it to trade the breakout. Good luck!
| (%) | ||
|
MARKETS TREND
The market trend factors in multiple indicators, including Simple Moving Average, Exponential Moving Average, Pivot Point, Bollinger Bands, Relative Strength Index, and Stochastic. |
- Check out our free forex signals
- Follow the top economic events on FX Leaders economic calendar
- Trade better, discover more Forex Trading Strategies
- Open a FREE Trading Account
