Selling the Retrace in AUD/USD at the 50 SMA
AUD/USD has retraced higher today, but the pullback seems complete at the 50 SMA
[[AUD/USD-sponsored]]
AUD/USD was one of the most bullish pais during last year, climbing more than 20 cents from the bottom to the top, as the USD kept declining. In the second half of last year the restrictions increased in Australia, which are still going in some areas, but the AUD kept climbing higher faster than most major currencies.
Although, the bullish trend came to an end by the last week of February after it flushed some weak stops above the big round level at $0.80. This pair lost nearly 5 cents until the first day of April and turned bullish again last month.
AUD/USD Live Chart
Although, the bullish trend wasn’t as strong which indicates weakness from buyers. In the last two days though, the trend changed again and this pair lost around 120 pips, as the USD turned bullish again. It could be the month-end flows, but the reversal today looks weak too.
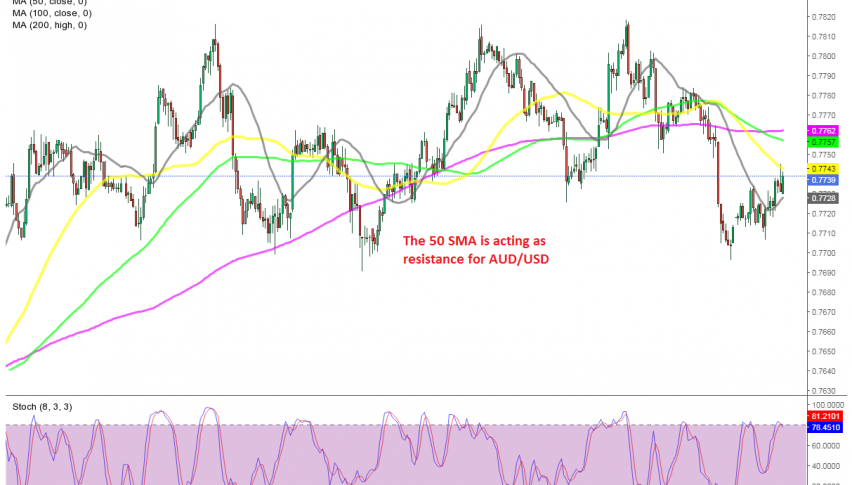
This pair reversed higher and was finding resistance at the 20 SMA (gray) last night, which was eventually broken. Although, now AUD/USD is finding resistance at the 50 SMA (yellow) on the H1 chart and the stochastic indicator is overbought, so we decided to open a sell forex signal below it, hoping that the retrace up is over. Now let’s wait and see if a bearish reversal will take place.
- Check out our free forex signals
- Follow the top economic events on FX Leaders economic calendar
- Trade better, discover more Forex Trading Strategies
- Open a FREE Trading Account