Ripple Price Forecast – Ascending Triangle Breakout, Bearish Bias to Dominate!
XRP/USD closed at $1.55474 after placing a high of $1.61913 and a low of $1.52413. Ripple dropped for the second consecutive session on
Written by:
Arslan Butt
•
Tuesday, May 4, 2021
•
2 min read
•
Last updated: Tuesday, May 4, 2021

[[XRP/USD-sponsored]]
XRP/USD closed at $1.55474 after placing a high of $1.61913 and a low of $1.52413. Ripple dropped for the second consecutive session on Monday despite having an increased market cap. The fourth-largest cryptocurrency by market capitalization, Ripple hit a new high with a market cap of $75 billion. This round-up for about 3.2% of the total market cap for cryptocurrencies. Ripple’s XRP has risen about 40% in the past week as the currency is doing well in its price recovery amid improvements in its lawsuit against SEC.
The recent surge to an all-time high level was driven by the announcement by Ripple that the firm will launch its IPO after the lawsuit. The prices even reached near $2.0 level in April on the back of the increased popularity of the crypto market. Last week, Ripple’s CEO Brad Garlinghouse said that the ongoing lawsuit involving his company was a threat to the innovation being generated by cryptocurrency. He also criticized the SEC approach and said that the United States was the only country on the planet that viewed XRP as a security. He added that Japan, UK, Switzerland, and Singapore viewed XRP as a currency. Yet, the home country was taking a different approach and trying to prove it as a security.
On the other hand,
BITCOIN recovered some of its previous losses and posted little gains on Monday that could not lift the
XRP prices. The cryptocurrency continued its bearish momentum despite the weak U.S. dollar on the day. The recent decline could be attributed to the negative developments in SEC lawsuits or simply the rising competition in the market.
XRP/USD Daily Technical Levels
Support Resistance
1.52087 1.60049
1.48642 1.64566
1.44125 1.68011
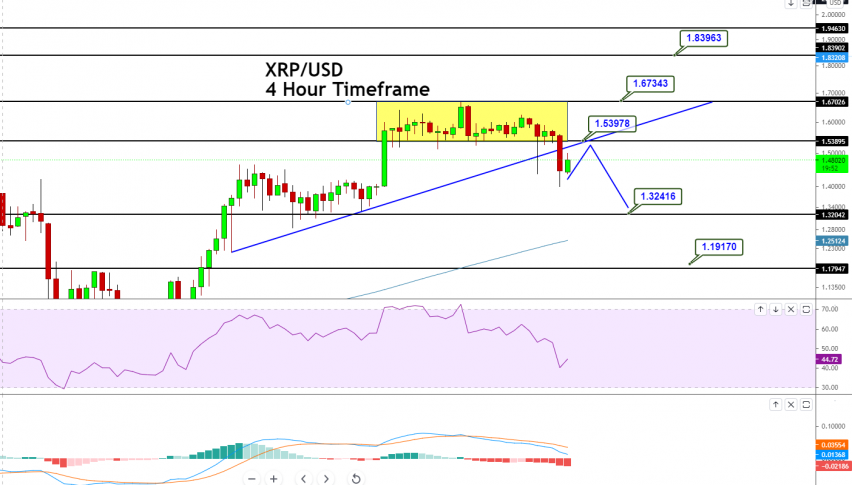
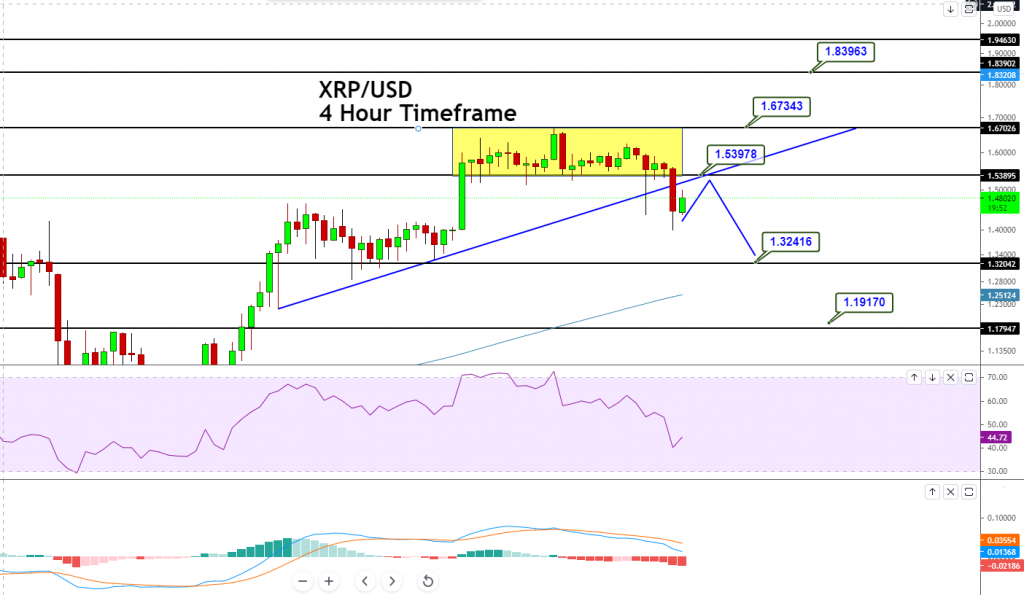
Pivot Point: 1.56604XRP/USD was consolidating in a sideways channel that kept it on hold at a 1.6090 level. However, the pair has violated the consolidation range of 1.6703 – 1.5389. Closing below this range is suggesting odds of bearish trend continuation. On the lower side, the pair is likely to head towards the next support area of 1.3240, while the resistance continues to stay at the 1.5397 level. The indicators like RSI and MACD are also demonstrating a selling trend in the XRP/USD pair. Let’s consider selling below 1.5660 level today. Good luck!
Arslan Butt
Lead Markets Analyst – Multi-Asset (FX, Commodities, Crypto)
Arslan Butt serves as the Lead Commodities and Indices Analyst, bringing a wealth of expertise to the field. With an MBA in Behavioral Finance and active progress towards a Ph.D., Arslan possesses a deep understanding of market dynamics.
His professional journey includes a significant role as a senior analyst at a leading brokerage firm, complementing his extensive experience as a market analyst and day trader. Adept in educating others, Arslan has a commendable track record as an instructor and public speaker.
His incisive analyses, particularly within the realms of cryptocurrency and forex markets, are showcased across esteemed financial publications such as ForexCrunch, InsideBitcoins, and EconomyWatch, solidifying his reputation in the financial community.
Related Articles