Crude Oil Gains Support Over 65.20 – Good Time to Go Long?
Crude oil was closed at $64.90 after placing a high of $65.24 and a low of $63.90. Crude oil remained flat throughout Friday and failed ...
Written by:
Arslan Ali Butt
•
Monday, May 10, 2021
•
2 min read
•
Last updated: Monday, May 10, 2021

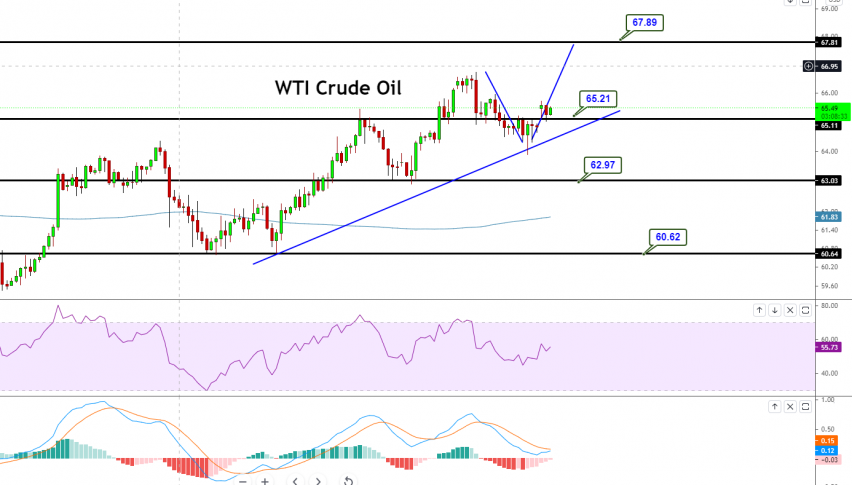
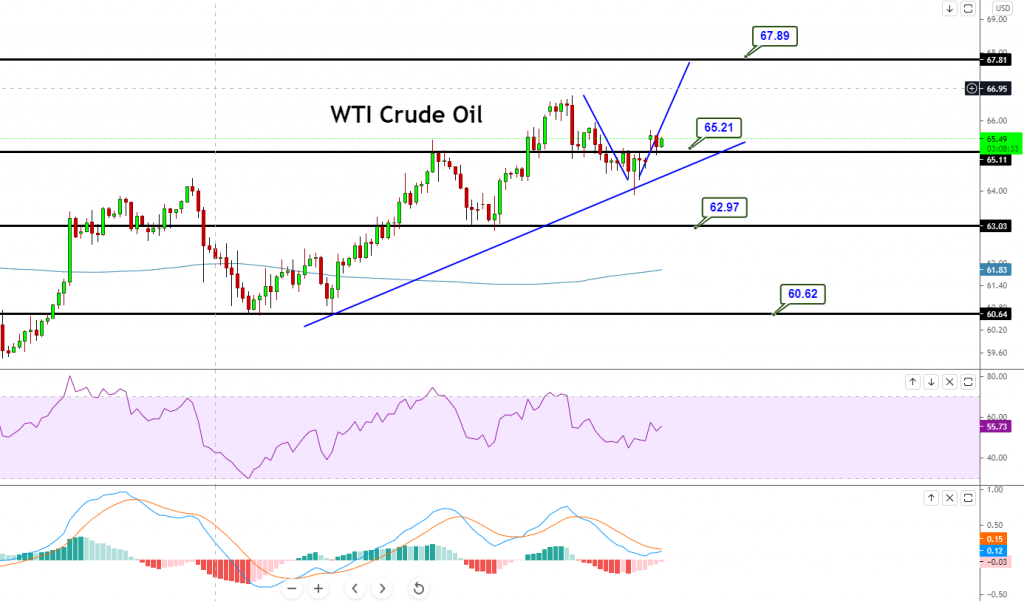
WTI Crude oil closed at $64.90 after placing a high of $65.24 and a low of $63.90. Crude oil remained flat throughout Friday and failed to make any significant moves despite the broad-based weakness in the U.S. dollar. During the early trading session, it remained under pressure and moved lower. Still, it managed to pull back in the second half of the day after the U.S. dollar started losing its strength amid poorer-than-expected jobs data from the Labor Department.
Despite a sudden decline in crude oil prices in the first half of Friday, the prices were set to post a weekly gain for the second consecutive week. The rising trend in WTI crude oil was supported by the reopening in the United States and Europe and a massive draw in the U.S. crude oil inventories last week. Due to a slowdown in oil demand in the world’s third-largest oil importer, India, the large crude oil draw was due to a slowdown.
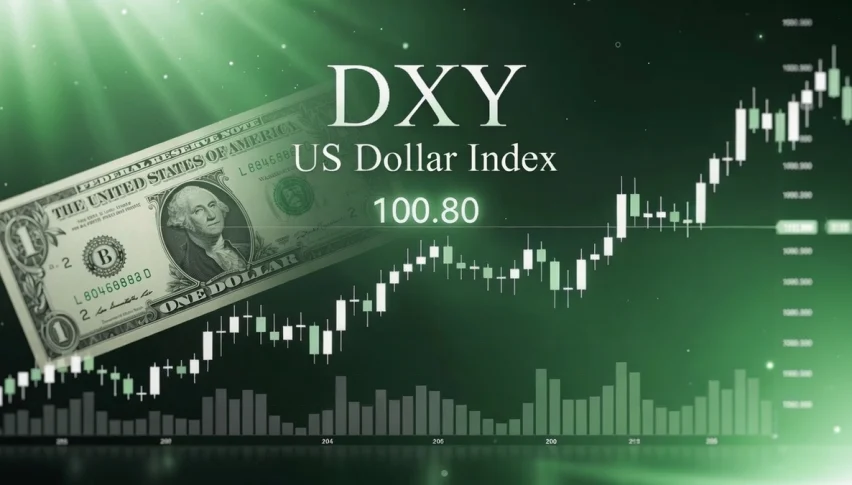
On Friday, India’s state-owned refiners ordered their regular volumes of Saudi crude oil for June after the kingdom reduced its prices. Saudi Arabia cut its official selling price for Asian clients earlier this month by between $0.10 and $0.30 in response to a surge in coronavirus infections in India that had a negative impact on oil demand.Furthermore, the decline in crude oil prices could also be attributed to the new stricter emission rules for oil and gas by New Mexico. A new law that would disallow any oil and gas company exemptions for reducing emissions was introduced in New Mexico by the New Mexico Environment Department. NMED proposed a rule that would improve air quality by removing all current exemptions for oil and gas wells and enact stricter emission standards for the industry. However, in the second half of the day, crude oil prices started to recover and pulled back on the back of renewed weakness in the U.S. dollar. The greenback was weak across the board due to the dismal jobs report on Friday. The U.S. Dollar Index also fell to $90.1 level after the disappointing NFP report.
Apart from the U.S. dollar’s weakness, the WTI oil prices were also supported by the latest report from the U.K., which suggested that fuel sales in the United Kingdom rose at the end of last week to their highest level since the first lockdown in March 2020. The report suggested that the reopening that began last month in the U.K. was already resulting in higher oil demand and economic growth.

Daily Technical Levels
Support Resistance
65.23 65.62
65.00 65.78
64.84 66.01
Pivot Point: 65.39The technical side of
WTI hasn’t changed a lot as crude oil is trading slightly bullish, holding a tight trading range of 66.55 – 63.08 level. The technical indicators suggest a strong bullish bias, as the MACD and RSI are tossing above mid-levels, indicating a bullish bias among investors. On the higher side, a bullish breakout of 66.55 levels can drive buying trends until 67. At the same time, the violation of the support at 63 support lead the WTI price lower towards 62 and even 60. Let’s keep an eye on 64 levels today, as selling can be seen below this and buying above the same level. Good luck!
Arslan Ali Butt
Lead Markets Analyst – Multi-Asset (FX, Commodities, Crypto)
Arslan Ali Butt serves as the Lead Commodities and Indices Analyst, bringing a wealth of expertise to the field. With an MBA in Behavioral Finance and active progress towards a Ph.D., Arslan possesses a deep understanding of market dynamics.
His professional journey includes a significant role as a senior analyst at a leading brokerage firm, complementing his extensive experience as a market analyst and day trader. Adept in educating others, Arslan has a commendable track record as an instructor and public speaker.
His incisive analyses, particularly within the realms of cryptocurrency and forex markets, are showcased across esteemed financial publications such as ForexCrunch, InsideBitcoins, and EconomyWatch, solidifying his reputation in the financial community.