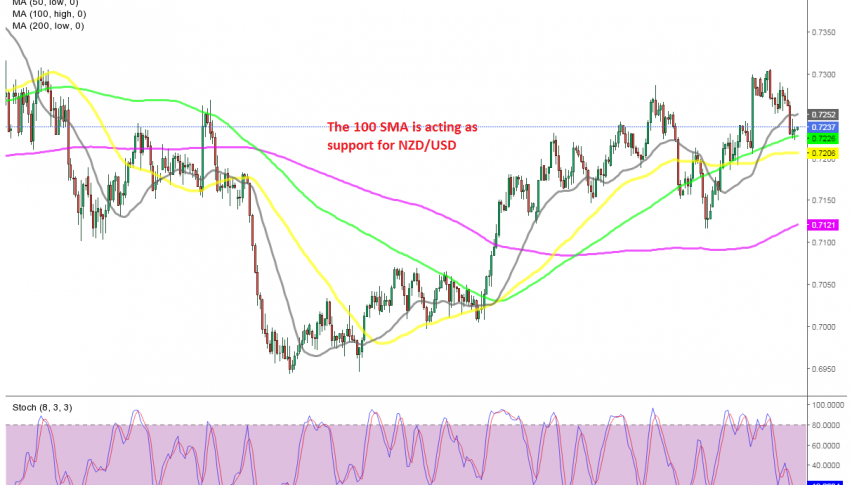
Buying the Pullback in NZD/USD at the 100 SMA
The decline in NZD/USD seems complete, so we decided to go long on this pair

The USD turned really berish ast year, despite the US economy rebounding better than most other large economies. Although, the excessive amount of cash thrown by the FED and the US government have helped to keep the USD down and the new round of the cash dispensed by the US government weakened the USD again in April.
In March, the USD started gaining some strength and NZD/USD turned bearish, losing around 5 cents as it fell below 0.69. But, the decline ended in April and the bullish trend resumed again in this forex pair.
NZD/USD started climbing and it moved above moving averages on the H4 chart. The pullbacks have found strong buying pressure, pushing the price higher and yesterday this pair moved above 0.73. We are seeing a pullback lower today, btu the pullbacks seems complete now, so we decided to open a buy forex signal for this pair.
The pullback down looks over now, with the stochastic indicator oversold. Besides that the 100 SMA (green) is providing support on this time-frame chart, while the previous candlestick closed as a doji which is also a bullish reversing signal. So, we are long on this pair now and it seems like the price is starting to reverse higher.
- Check out our free forex signals
- Follow the top economic events on FX Leaders economic calendar
- Trade better, discover more Forex Trading Strategies
- Open a FREE Trading Account


